System information Liveboard
The System Information and Usage Liveboard provides useful information about your cluster.
You can view system and usage information for your ThoughtSpot cluster from the TS Stats: System Information and Usage Liveboard. This Liveboard contains several charts and tables that track monthly active users, top Liveboards by number of views, today’s users, and so on.
To view this Liveboard, select Admin from the top navigation bar. Select System information from the side navigation bar.
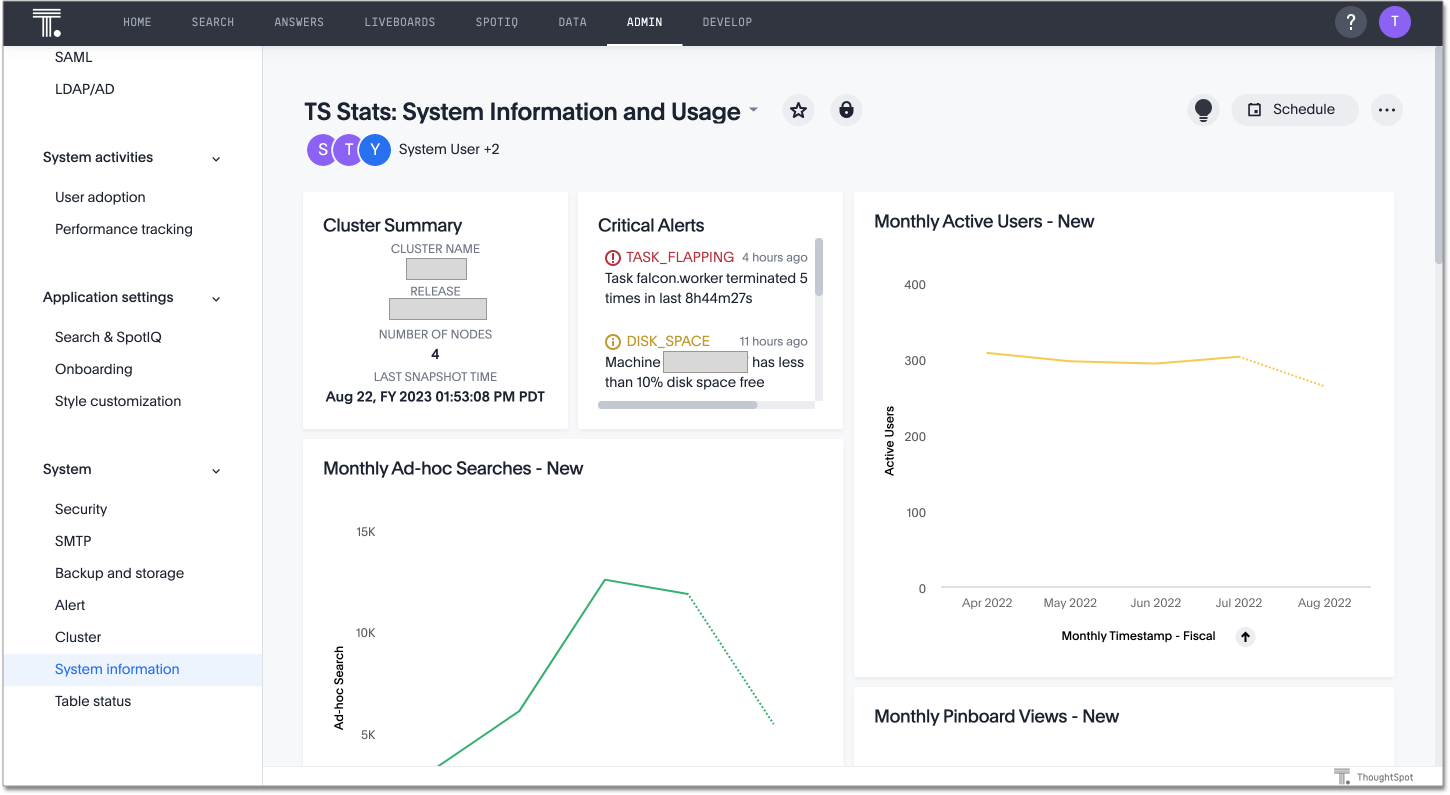
Understand the TS Stats: System Information and Usage Liveboard
The TS Stats: System Information and Usage Liveboard page consists of standard ThoughtSpot answers that update in real time and rely on internal system data. The answers rely on underlying system worksheets, which are available to ThoughtSpot administrators. The information in these worksheets updates hourly from internal tables that collect monitoring statistics.
The more options menu  for the answers in this Liveboard contains fewer options than the traditional menu.
You can Pin, SpotIQ analyze, download, edit, or present the answer.
When you edit the Answer, you see the query that ThoughtSpot built the answer on.
You can also copy the answer’s embed link, use Answer Explorer on the answer, or interact with the answer by drilling down.
While you can interact with and change a copied version of the answer, you can’t save changes to the underlying query.
for the answers in this Liveboard contains fewer options than the traditional menu.
You can Pin, SpotIQ analyze, download, edit, or present the answer.
When you edit the Answer, you see the query that ThoughtSpot built the answer on.
You can also copy the answer’s embed link, use Answer Explorer on the answer, or interact with the answer by drilling down.
While you can interact with and change a copied version of the answer, you can’t save changes to the underlying query.
The following charts, tables, and panels are available on the TS Stats: System Information and Usage Liveboard: cluster summary, critical alerts, monthly active users, monthly ad hoc searches, monthly Liveboard views, top users last month, top Liveboards last month, ad-hoc search by user, today’s users, and configuration events.
Cluster Summary
This system panel contains basic information about your cluster. The NUMBER OF NODES is the number of installed nodes. This doesn’t reflect the active nodes which may be more or less.
This summary includes the LAST SNAPSHOT TIME it reflects whether regular snapshots of your cluster are collected.
This value should update regularly in real time.
If you don’t see it change or empty, you should check your cluster snapshot policy using the tscli command:
$ tscli snapshot-policy show
schedule {
  period {
    number: 1
    unit: HOUR
  }
  retention_policy {
    bucket {
      time {
        number: 1
        unit: HOUR
      }
      capacity: 3
    }
    bucket {
      time {
        number: 4
        unit: HOUR
      }
      capacity: 2
    }
  }
  offset_minutes_from_sunday_midnight: 0
}
enabled: false
You can see this policy is disabled, which is a problem.
Production clusters should enable the default snapshot policy.
When you show or enable the snapshot policy, you can see your tscli command reflected in the Configuration Events panel on this same page.
Display the features used in a cluster configuration
-
Sign in to the ThoughtSpot cluster as the
adminuser. -
Use the
tscli featuresubcommand to display your current configuration.$ tscli feature get-all-config +---------------------------------+----------+---------------+ | NAME | STATUS | CONFIGURATION | +---------------------------------+----------+---------------+ | Firewall | Disabled | | | Saml | Disabled | | | Ldap | Disabled | | | CustomBranding | Disabled | | | CustomBrandingFontCustomization | Disabled | | | DataConnect | Disabled | | | RLS | Enabled | | | Callhome | Enabled | | | SSHTunnel | Enabled | | | Fileserver | Disabled | | +---------------------------------+----------+---------------+
Critical Alerts
Displays critical and warning alerts.
This includes when an alert was generated and from which service and machine.
Administrators can get a custom report by issuing a tscli alert list on the appliance:
tscli alert list --since 4w
The possible alert types are CRITICAL, WARNING, ERROR, and INFO.
For a full reference, see the Alert code reference.
Space Utilization
The Space Utilization chart displays your cluster’s total capacity and estimated used capacity over time.
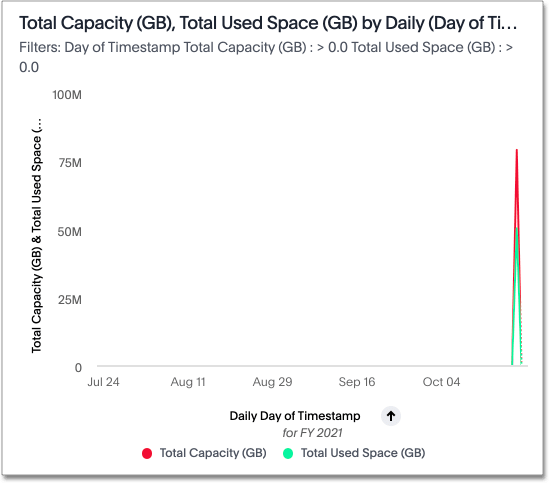
The x-axis is by time and the y-axis measures the size in GB. You can zoom in and see daily or hourly utilization data. So, in the Space Utilization chart, the green line shows the amount of capacity in use in the system, while the red line shows the total capacity. An increase in the red line at the end of a time period indicates the addition of extra hardware, resulting in increased capacity.
The query for this Answer is the following:
day of timestamp
total capacity (gb)
total used space (gb)
daily
last 90 days last 25 hours
total capacity (gb) > 0
total used space (gb) > 0
The chart relies on the TS: Internal Table Wise Capacity WS worksheet.
It tracks total used space, which consists of raw uncompressed data, including replication.
Monthly Active Users
This chart shows the number of active users in the system over the last four months, and during the current month. An active user is defined as a user who has logged in at least one time in the defined time interval, in this case months.
The query for this answer is the following:
monthly
last 4 months this month
active users
user != {null}
This query relies on the TS: BI server worksheet.
Monthly Ad hoc Searches
Number of ad hoc searches (queries) issued per month. An ad hoc query is defined as any search or change to a search that builds a new answer (result). An ad hoc search can also be generated through SpotIQ or another UI/API interaction.
ThoughtSpot considers all of the following as ad hoc searches (queries):
-
User edits tokens (boxed terms) in the search bar.
-
User opens an existing saved answer and makes changes to tokens in the search bar.
-
User opens an existing saved Liveboard, edits a visualization, and makes change to the search tokens.
-
Searches initiated by an API call for data with runtime filters
It isn’t considered a search (query) in this context if a user opens an existing saved aggregated worksheet and makes changes to its underlying query.
The query for this answer is the following:
ad-hoc search
user action = 'answer_pinboard_context' 'answer_saved' 'answer_unsaved'
monthly
last 4 months this month
This answer relies on data from the TS: BI server worksheet.
Monthly Liveboard Views
Number of times a saved Liveboard is viewed by a user. These scenarios are considered Liveboard views:
-
User opens an existing saved Liveboard.
-
User opens an embedded Liveboard from a URL.
-
Liveboard data is accessed using an API.
These scenarios are not considered Liveboard views:
-
A user opens SpotIQ tab Liveboards.
-
A user opens admin tab Liveboards.
-
The system loads a Liveboard on the homepage.
The query underlying this answer is:
pinboard views
user action = 'pinboard_embed_view' 'pinboard_tspublic_no_runtime_filter' 'pinboard_tspublic_runtime_filter' 'pinboard_view'
monthly
last 4 months this month
The query uses the TS: BI server data source.
Top Users Last Month
This answer shows the top ThoughtSpot users ranked by number of actions the users performed in the last 30 days. The possible user actions include:
|
User adds a filter using the UI. |
|
User opens an existing saved aggregated Model and makes changes to tokens in the search bar. |
|
User updates aggregated Model. |
|
An Answer opened with help requested. |
|
User opens an existing saved Liveboard, edits a context viz and makes a change to tokens in the search bar. |
|
User opens an existing saved Answer and makes changes to tokens in the search bar. |
|
User makes a change to tokens in the search bar. |
|
Requests made for the sole purpose of upgrade. |
|
User opens an existing, saved Answer. |
|
A list of Views opened by the user. |
|
A View saved by the user. |
|
User opens an existing saved Liveboard, edits a context viz. |
|
Request for new data being generated following a chart config change. |
|
Request to export data. Recorded for Liveboard exports and Answer chart image (PNG) downloads. See Tracking answer downloads. |
|
Request to show underlying data for a data row(s). |
|
Request to show underlying data for a data viz. |
|
User drills down in a Liveboard viz. |
|
User opens admin tab Liveboards. |
|
User opens embed Liveboard from a URL. |
|
User adds, removes or applies values to a Liveboard filter. |
|
On loading of home page Liveboard. |
|
User opens SpotIQ tab Liveboards. |
|
On loading learn Liveboard. |
|
The filter panel applied inside a print view. |
|
A Liveboard loaded by the PDF renderer. This action is recorded for a Liveboard PDF download or a scheduled PDF email. A Liveboard export therefore produces this row in addition to a |
|
Request to TSPublic/pinboard data without runtime filters. |
|
Request to TSPublic/pinboarddata with runtime filters. |
|
User opens an existing saved Liveboard. |
|
Liveboard PDF export via the public REST API. |
|
A View opened by the user. |
Tracking Answer downloads
The data_export user action is recorded for Liveboard exports and Answer chart image (PNG) downloads only.
Table downloads from an Answer (CSV, XLSX, PDF) are not tagged with a user_action value and do not appear in the TS: BI Server worksheet when you filter by this action.
To track Answer table downloads, filter the TS: BI Server worksheet on URL contains data/answerbook/export. Each row represents one Answer download and includes the user, timestamp, response size, and status.
|
The Answer name and GUID columns are empty for Answer download rows. |
Security audit logs do not cover downloads or exports. They cover metadata, group, and role changes only.
The query underlying this answer is:
top 10
ranked by user actions
user action != 'invalid'
user != {null}
user
last 30 days today
The query uses the TS: BI server data source.
Top Liveboards Last Month
This answer shows the top ThoughtSpot Liveboards ranked by number of views in the last 30 days.
The query underlying this answer is:
top 10
ranked by pinboard views
user action = 'pinboard_embed_view' 'pinboard_tspublic_no_runtime_filter' 'pinboard_tspublic_runtime_filter' 'pinboard_view'
pinboard != {null}
pinboard
last 30 days today
The query uses the TS: BI server data source.
Ad hoc search by user
This answer shows the top ten ThoughtSpot users ranked by the number of ad hoc searches they have completed.
The query underlying this answer is:
top 10
ad-hoc search
user action = 'answer_pinboard_context' 'answer_saved' 'answer_unsaved
by user
sort by ad-hoc search
The query uses the TS: BI server data source.
Today’s users
This answer shows all users who logged in to ThoughtSpot today.
The query underlying this answer is:
latest time
by user
user !={null}
today
The query uses the TS: BI server data source.
Configuration Events
This system answer displays recent events that changed the configuration of the system. This panel displays possible configuration events:
- Cluster Configuration
-
Reports configuration actions from the
tscliandtqlcommands. - Metadata Management
-
Events related to metadata such as column names, column visibility, column and data definition, column rank and so forth.
- User Management
-
Events related to creating, updating, or adding new users and groups.
For a more detailed list, including the user that issued a command, you can use the tscli event list command.
Administrators can ssh into the cluster and specify a time period or even a type of command to include.
[admin@testsystem ~]$ tscli event list --since 3d
+-------------------------------+-----------------------+----------------------------+
|             DATE              |       USER            |           SUMMARY          |
+-------------------------------+-----------------------+----------------------------+
| 2018-03-06 11:57:10 -0800 PST |eadmin@thoughtspot.int | User Management: User      |
|                               |                       | "guest_1" updated          |
| 2018-03-06 11:48:10 -0800 PST |admin                  | tscli node ls              |
| 2018-03-06 11:17:04 -0800 PST |eadmin@thoughtspot.int | Metadata Management:       |
|                               |                       | Metadata object "Number of |
|                               |                       | Opportunity                |
|                               |                       | AE and Stage" of type      |
...