ThoughtSpot add-in for Microsoft PowerPoint
The ThoughtSpot plug-in for Microsoft PowerPoint™ is an add-in that allows you to connect to a ThoughtSpot instance, and pull data directly into a PowerPoint slide sheet from trusted data sources connected to that instance (like Snowflake, Google BigQuery, Databricks, and others) for ad-hoc analysis.
Details
-
Requires a ThoughtSpot license and an email linked to a ThoughtSpot user ID.
-
Requires the
Can download dataprivilege in ThoughtSpot to use this add-in. -
For RBAC enabled clusters, it requires the Can Download Visuals privilege.
-
Available both for Windows devices and macOS desktop application.
-
You can sign up for a ThoughtSpot free trial account to use this add-in.
-
Only compatible with ThoughtSpot Cloud.
-
Also supports Orgs.
Setup
| Contact ThoughtSpot Support for assistance on the first time configuration of the security settings. |
-
Open PowerPoint. To download the plug-in, Select Home > Add-ins, which brings up the PowerPoint Add-ins window. Search for ThoughtSpot, which will then show ThoughtSpot for PowerPoint in the list.
-
Click Add to download.
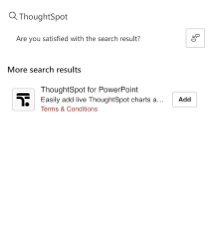
Upon clicking Add you will receive a pop-up with the license agreement. Click Accept and Continue to proceed.
-
Open a new PowerPoint slide and navigate to Home > ThoughtSpot Analytics.
The ThoughtSpot panel appears.
-
Enter the URL of your ThoughtSpot instance, or click the free trial link if you do not have an instance.

-
Click Continue.
-
Sign in to your ThoughtSpot instance using your ThoughtSpot username and password or SSO.
By default, Single Sign-On (SSO) is available when logging in through a web browser. To enable SSO for the Windows or Mac desktop apps, please contact ThoughtSpot Support. -
From here you can browse ThoughtSpot Answers and Liveboards for visualizations to insert into your PowerPoint presentation. You can browse all, your favorites, or just the ones you created.
-
Find an Answer or Liveboard, and open it by clicking it.
-
Find the visualization you want to insert in your slide and click Insert into slide.
The visualization is inserted into your PowerPoint presentation. After inserting a visualization, you can resize it. Any changes to the size or position are retained even after the visualization is updated in the future.
Updating visualizations
To update all visualizations in your PowerPoint presentation:
-
Click All slides.
-
Click Update.
To update one or more visualizations in an individual slide of your PowerPoint presentation:
-
Go to the slide you want to update.
-
Click Current slide.
-
Click Update.
|
When you update All slides, the system parses all slides and inserts or updates all the visualizations. It is recommended to not click or interact with the interface while this workflow is running. |

Enhanced visualizations Early Access
ThoughtSpot automatically optimizes the resolution and scaling of chart PNG exports in the Microsoft PowerPoint add-in, improving their legibility. For KPI without time-series chart type, the hero number is now automatically sized and positioned to fill the visualization area, so you no longer need to crop images after inserting or refreshing them.
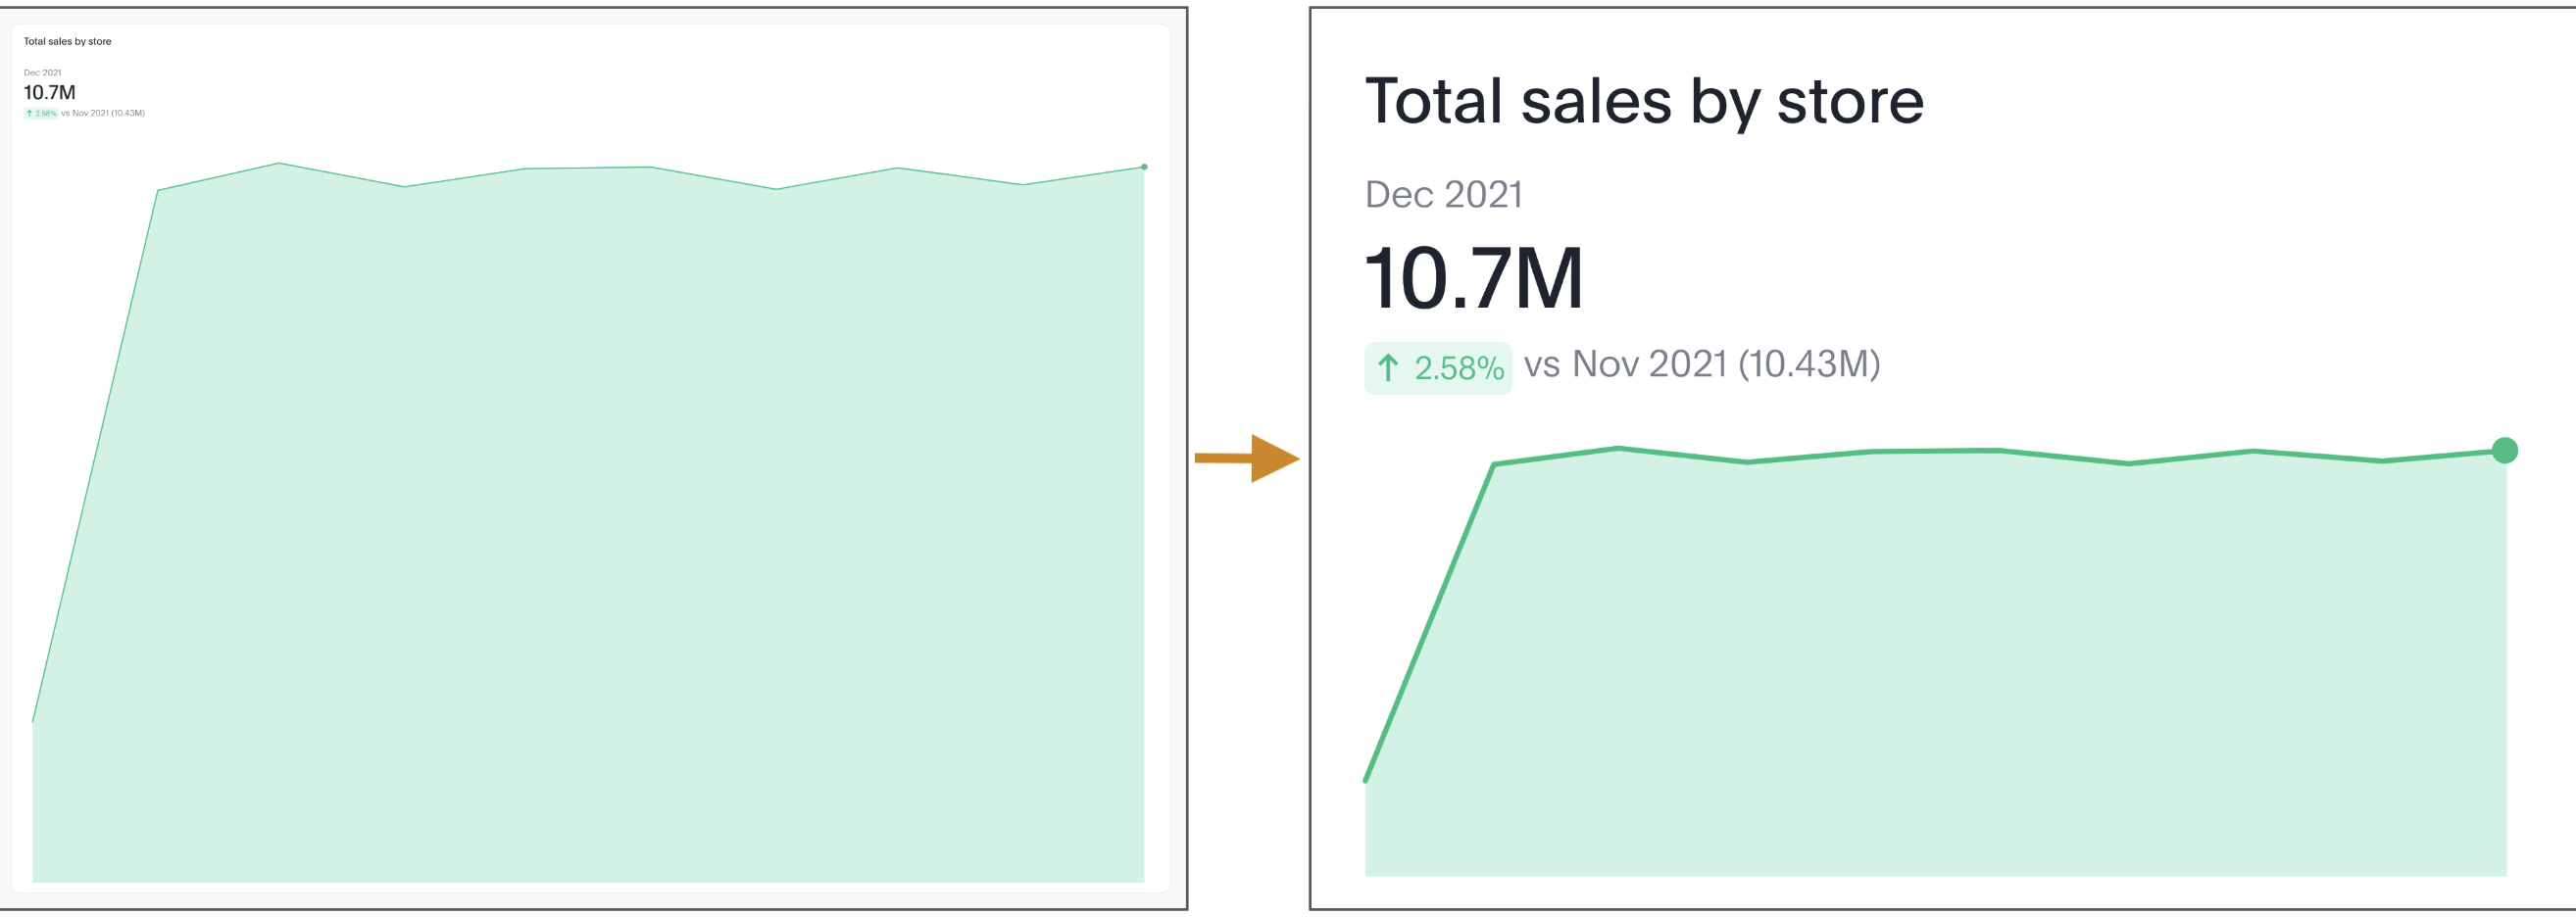
These improvements require the Enhanced Answer Report API feature to be enabled on your ThoughtSpot instance. Contact your ThoughtSpot administrator to enable this feature. If the feature is disabled, the previous default resolution and layout behavior applies.
When the feature is toggled on or off, existing PNG images embedded in your presentation are updated to the new defaults the next time you refresh the visualizations.