ThoughtSpot Connected Slides
ThoughtSpot Connected Slides is an add-on that allows you to insert charts and live data visualizations right into your Google Slides™ presentation.
Details
-
Requires a ThoughtSpot license and an email linked to a ThoughtSpot user ID.
-
If you don’t currently have a User ID, you can sign up for ThoughtSpot free trial to use this add-on.
-
Requires the
Can download dataprivilege in ThoughtSpot to use this add-on, and to export ThoughtSpot data into your Google Slide. -
For RBAC enabled clusters, it requires the Can Download Visuals privilege.
-
Only compatible with ThoughtSpot Cloud.
| Contact ThoughtSpot Support for enabling Orgs support for your ThoughtSpot Connected Slides add-on. |
First-time setup
-
Download ThoughtSpot Connected Slides.
-
Select Extensions > ThoughtSpot Connected Slides > Launch.
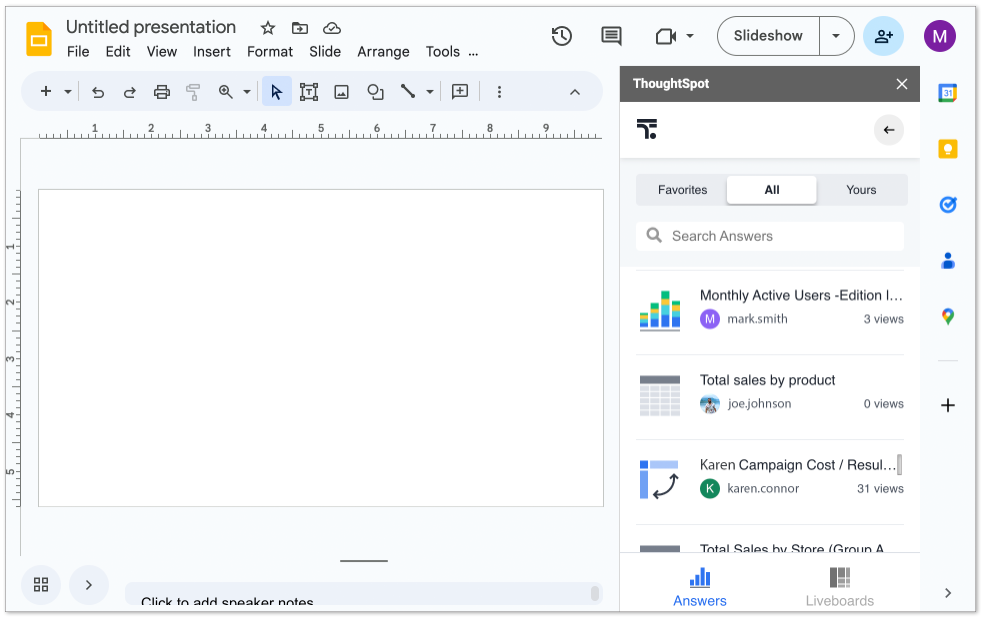
The ThoughtSpot panel appears.
-
Enter the URL of your ThoughtSpot instance, or click the free trial link if you do not have an instance.
-
Sign in to your ThoughtSpot instance using your ThoughtSpot username and password or SSO.
By default, Single Sign-On (SSO) is available when logging in through a web browser. To enable SSO for the Windows or Mac desktop apps, please contact ThoughtSpot Support. From here you can browse ThoughtSpot Answers and Liveboards for visualizations to insert into your Google Slides presentation. You can browse all, your favorites, or just the ones you created.
-
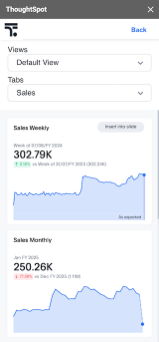
Find an Answer or Liveboard, and open it by clicking it.
-
Find the visualization you want to insert in your slide, and click Insert into slide.
The visualization is inserted into your Google Slides presentation. After inserting a visualization, you can resize it. Any changes to the size or position are retained even after the visualization is updated in the future.
Updating visualizations
When a visualization changes in ThoughtSpot, you can easily update that visualization in your Google Sheets presentation.
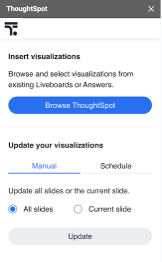
You have two options for updating visualizations available from the first page of the ThoughtSpot Connected Slides panel.
Manual Update
To update all visualizations in your Google Slides presentation:
-
Click All slides.
To update one or more visualizations in an individual slide of your Google Slides presentation:
-
Go to the slide you want to update.
-
Click Current slide.
Scheduled Update
You can also schedule a periodic update of all the visualizations in your Google Slides presentation. There is an option of setting up the schedule for the Day, Week, or the Month.
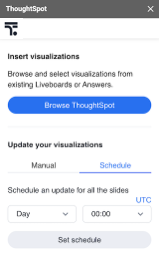
Daily schedule
For setting up a daily schedule, perform the following steps:
-
Click the Schedule tab and then select Day from the dropdown.
-
You can choose the time zone and then setup a time for the update.
See this page for a list of supported time zones.
-
Click Set Schedule.
Weekly schedule
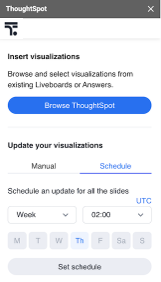
For setting up a weekly schedule, perform the following steps:
-
Click the Schedule tab and then select Week from the dropdown.
-
You can choose the time zone and then setup a time for the update.
See this page for a list of supported time zones.
-
Select the days of the week for the update.
-
Click Set Schedule.
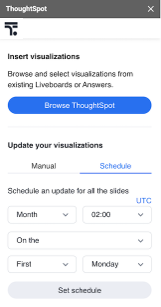
Monthly schedule
For setting up a monthly schedule, perform the following steps:
-
Click the Schedule tab and then select Month from the dropdown.
-
You can choose the time zone and then setup a time for the update.
See this page for a list of supported time zones.
-
Monthly update can be set either by the day or the date.
-
For setting it up the day:
-
Select On the from the dropdown.
-
Choose the day of the week you want to set it up for.
-
Choose the order of occurrence for the day in the week.
-
-
For setting it up by the date:
-
Select By date from the dropdown.
-
Enter the date(s) of the month for the update. You can enter multiple dates separated by a comma.
-
-
-
Click Set Schedule.
|
Deleting a schedule
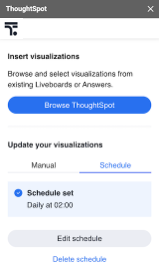
Once a schedule is set, you will be able to see the option to delete it. Click Delete schedule to delete any schedule. Click Edit schedule to make any changes to it.
Enhanced visualizations Early Access
ThoughtSpot automatically optimizes the resolution and scaling of chart PNG exports in the Google Slides add-in, improving their legibility. For KPI without time-series chart type, the hero number is now automatically sized and positioned to fill the visualization area, so you no longer need to crop images after inserting or refreshing them.
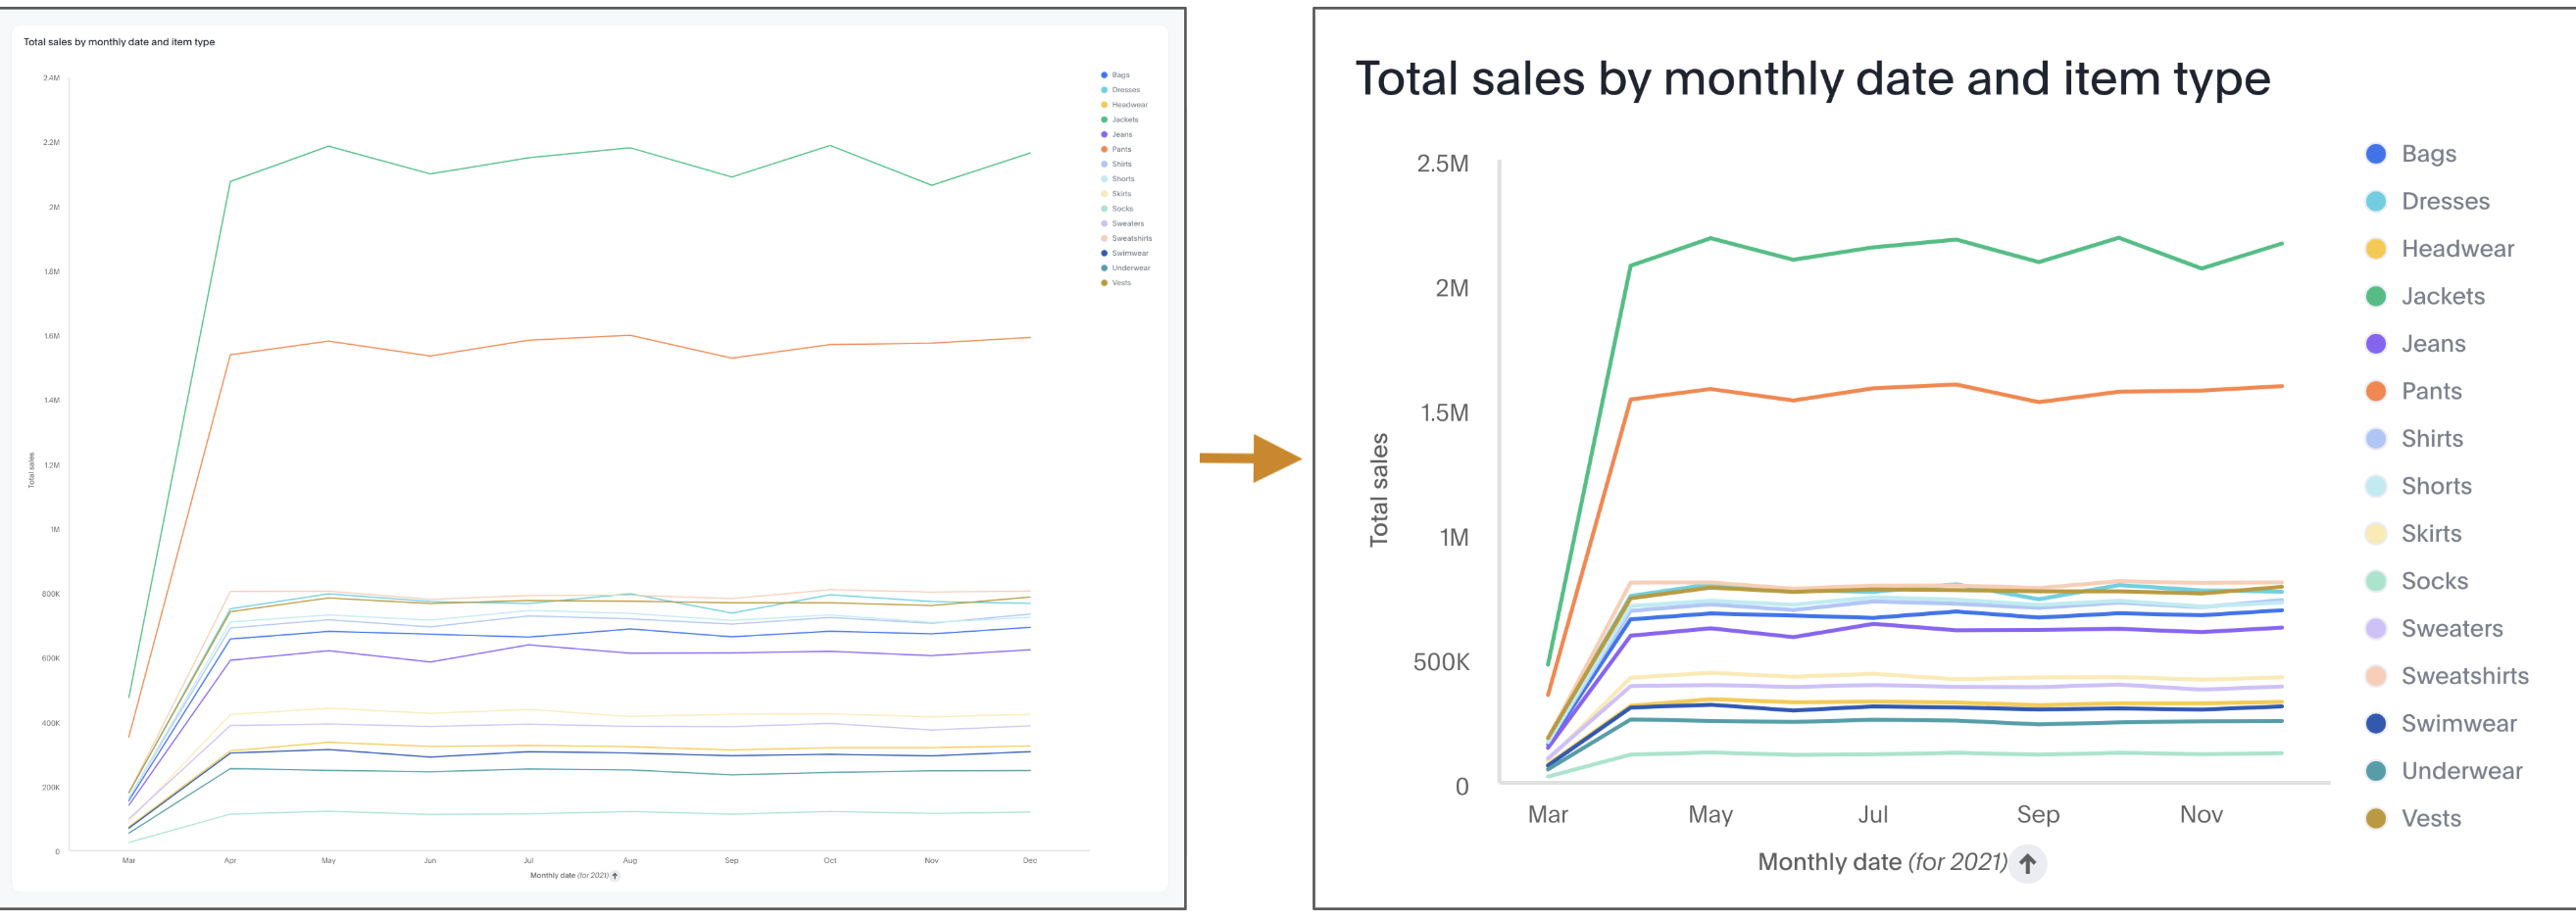
These improvements require the Enhanced Answer Report API feature to be enabled on your ThoughtSpot instance. Contact your ThoughtSpot administrator to enable this feature. If the feature is disabled, the previous default resolution and layout behavior applies.
When the feature is toggled on or off, existing PNG images embedded in your slides are updated to the new defaults the next time you refresh the visualizations.
Visualizations link to the Answer or Liveboard
You can easily go to the original visualization in an Answer or Liveboard in ThoughtSpot by doing the following:
-
Go to a slide which contains a visualization.
-
Click the visualization to select it.
The name of the visualization appears at the bottom, which is a link to the visualization in ThoughtSpot.
-
To go to the visualization in ThoughtSpot, click the name of the visualization.
This allows you to easily go back into ThoughtSpot to change the visualization.