Waterfall charts
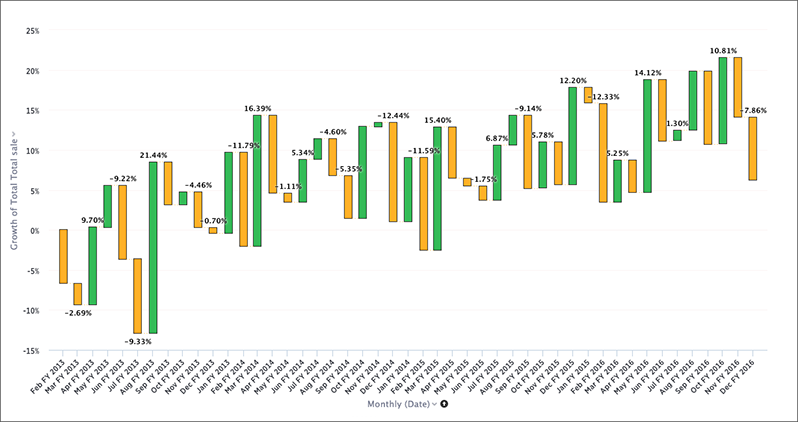
Waterfall charts are good for visualizing positive and negative growth, and therefore work well with the growth over time keyword. The columns are color-coded to distinguish between positive and negative values.
Your search needs at least one attribute and one measure to be represented as a waterfall chart.
Was this page helpful?Give us feedback!


