ThoughtSpot Cloud Documentation
ThoughtSpot Cloud™ is our hosted and managed Software as a Service (SaaS) offering. ThoughtSpot Cloud is available on Amazon Web Services (AWS) and Google Cloud Platform (GCP). Customers can choose the cloud and region where they would like their ThoughtSpot Cloud service deployed.
ThoughtSpot Cloud offers multiple advantages over deployment form factors that you have to manage and maintain within your own organization.
Find topics for the common types of ThoughtSpot users.
What’s new in ThoughtSpot Cloud
November 2024 10.4.0.cl
| Features marked as Beta are off by default. To enable them, contact ThoughtSpot Support. |
Spotter for Cloud
Introducing Spotter, our new AI-powered, unified conversational search experience. This feature replaces the previous Sage search experience. When enabled, you can enter the Spotter interface from the search bar on the Home page, or by clicking Spotter on any visualization pinned to a Liveboard.
You can ask successive questions to hone in on business insights, open a preview of the underlying data, drill down, edit or undo changes to the resulting AI-generated Answers, see what terms Spotter changed from question to question, and submit feedback to train Spotter’s interpretations. Analysts can also coach Spotter on how to interpret certain terms from the Admin page. For more information, see Spotter for Cloud.
Chart visualization enhancements
We made the following changes to visualizations on Liveboards:
-
You can now hover over items in a visualization’s legend to highlight the data that corresponds to that column.
-
You can hover over a truncated legend to see the corresponding column name in a tooltip.
-
We improved the readability for the smallest size of Liveboard visualizations. Now, minimum-sized visualizations display only the chart, omitting the x- and y-axes and labels. You can hover over select data points to see the values.
For more information, see Basic Liveboard usage.
Compact Liveboard header Early Access
We have streamlined the design of Liveboard headers to ensure maximum visibility of Liveboard visualizations no matter the size of the screen. To enable this feature, contact your administrator. For more information, see Liveboards.

Configuring color gradients Early Access
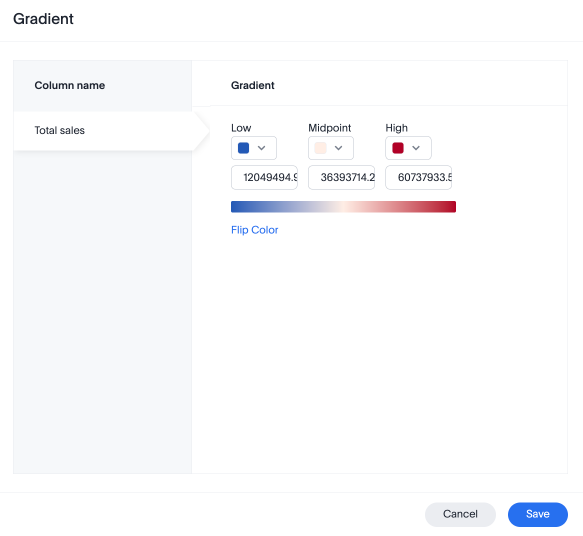
You can now choose multiple colors to define a gradient in charts that support gradients — geo heatmap, geo area, heatmap, and treemap charts. You can control the low, mid, and high values, and numerical value points to customize the gradient. For more information, see Change chart colors.
ThoughtSpot Sync: send full image of Liveboard to Slack Beta
ThoughtSpot introduces the ability for users to choose to export a Liveboard as a PDF or a PNG image when creating a new sync pipeline. PDFs include the complete Liveboard. PNG images are of the first page of the Liveboard. To enable this feature, contact ThoughtSpot Support.
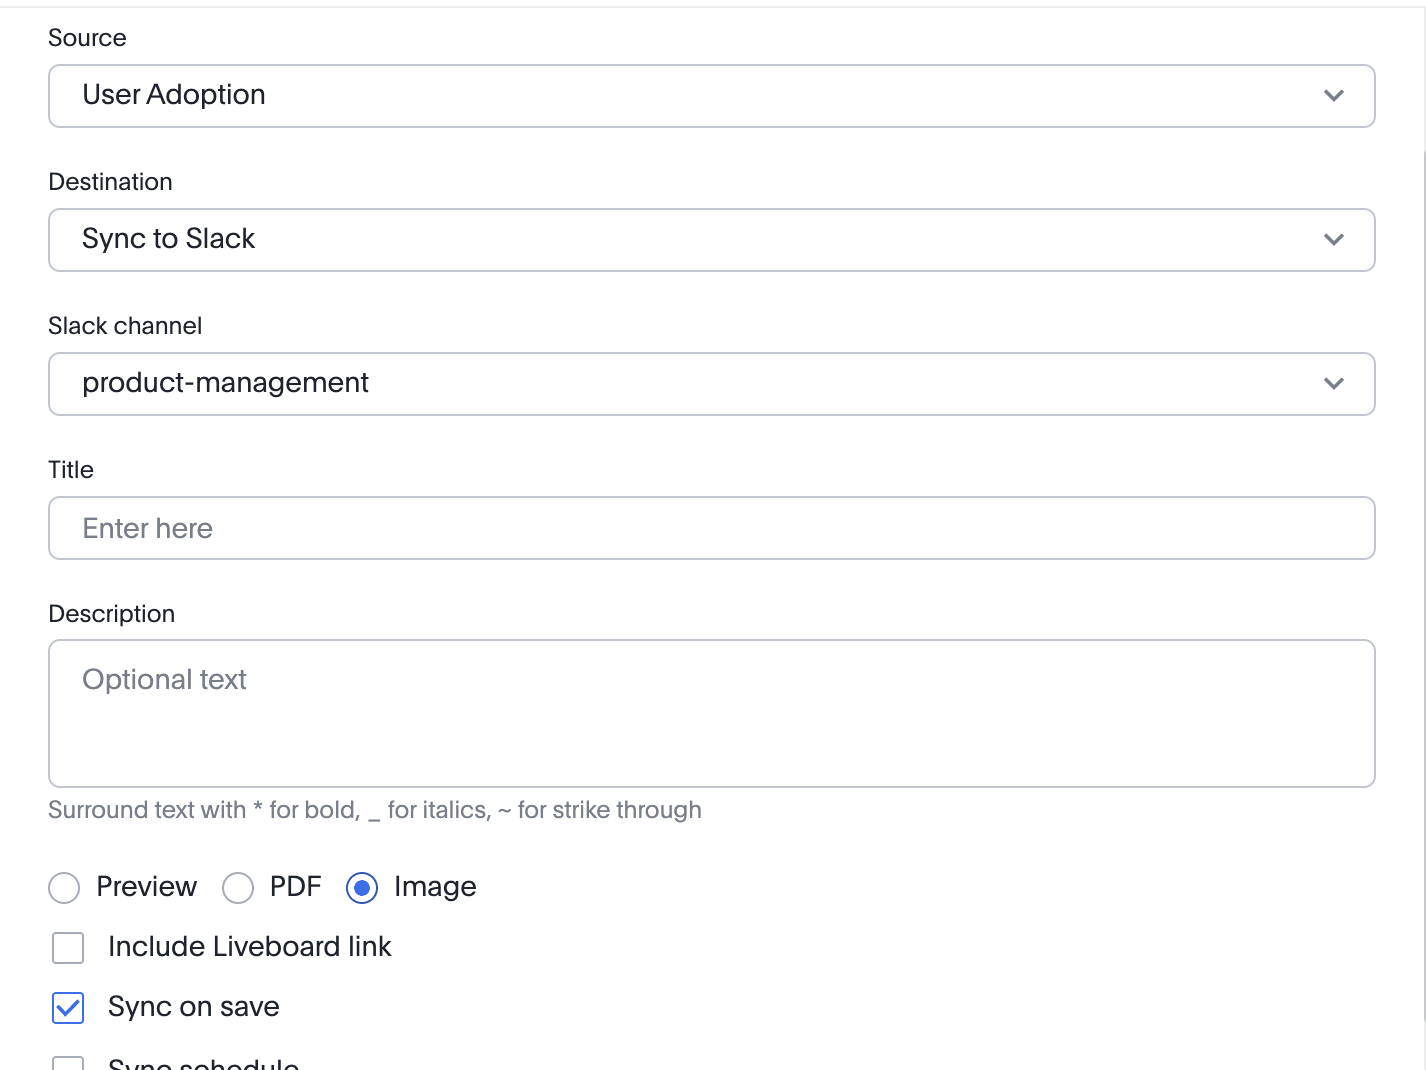
For more information, see Sync data from ThoughtSpot to Slack.
Other features and enhancements
Models
Models are now available to all customers and enabled by default. Worksheets are now deprecated and will be removed in a future release. Existing Worksheets continue to be available and editable, but Worksheet creation is disabled by default. To enable Worksheet creation, you must contact your ThoughtSpot administrator. You can migrate an individual Worksheet to a Model. Bulk migration of Worksheets to Models will be available in the 10.5.0.cl release. For more information, see Models.
Model knowledge cards Early Access
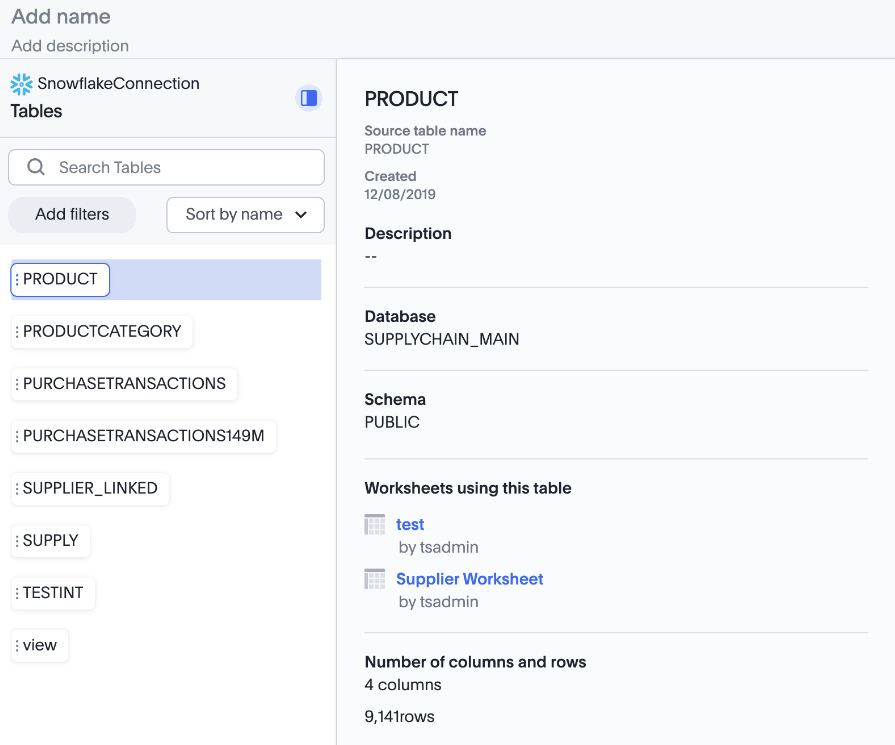
With knowledge cards, you can now see more detail about tables and columns before you add them to a Model. To view the knowledge card, click the knowledge card button ![]() , and then click the table or column. To enable this feature, contact your ThoughtSpot administrator.
For more information, see
Knowledge cards.
, and then click the table or column. To enable this feature, contact your ThoughtSpot administrator.
For more information, see
Knowledge cards.
Updated joins tab for Worksheets and Models
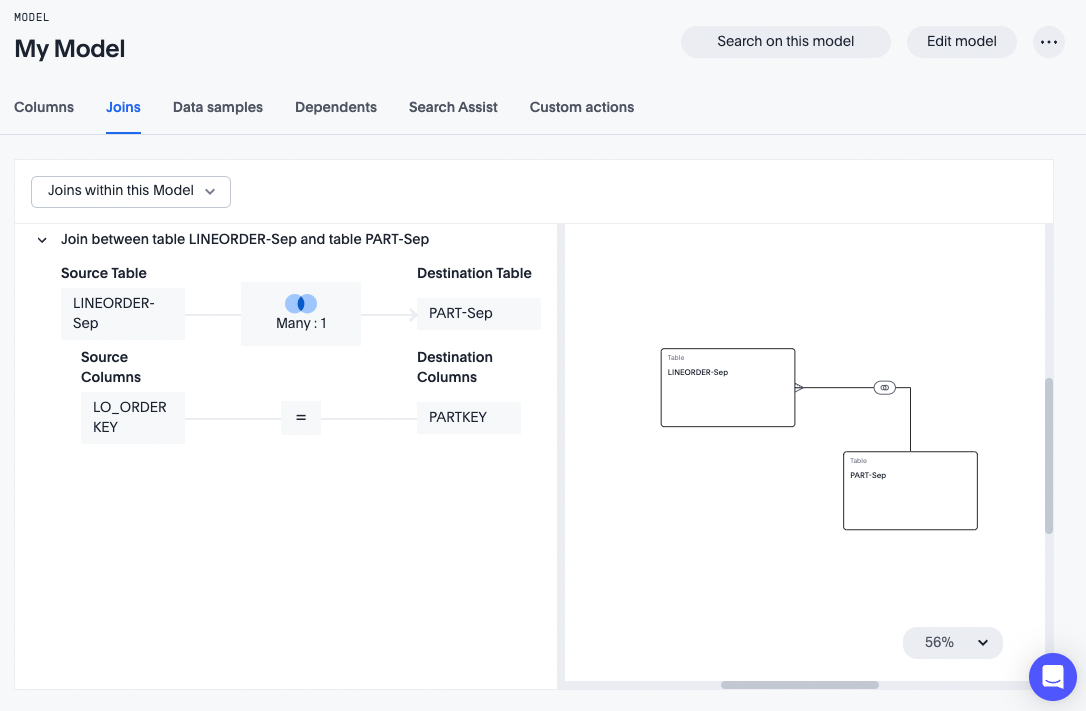
The joins tab for Worksheets and Models is now updated to match the join creation UI for Models.
Control default and available chart types Beta
You can now control the default display mode for Answers (table or chart). You can also decide which chart types are available and default for your cluster. For example, you can set the default chart type for an Answer as a bar chart. You could also decide to remove pie charts from your cluster. To enable this feature, contact ThoughtSpot Support. For more information, see Control default and available chart types.
ThoughtSpot Status Beta
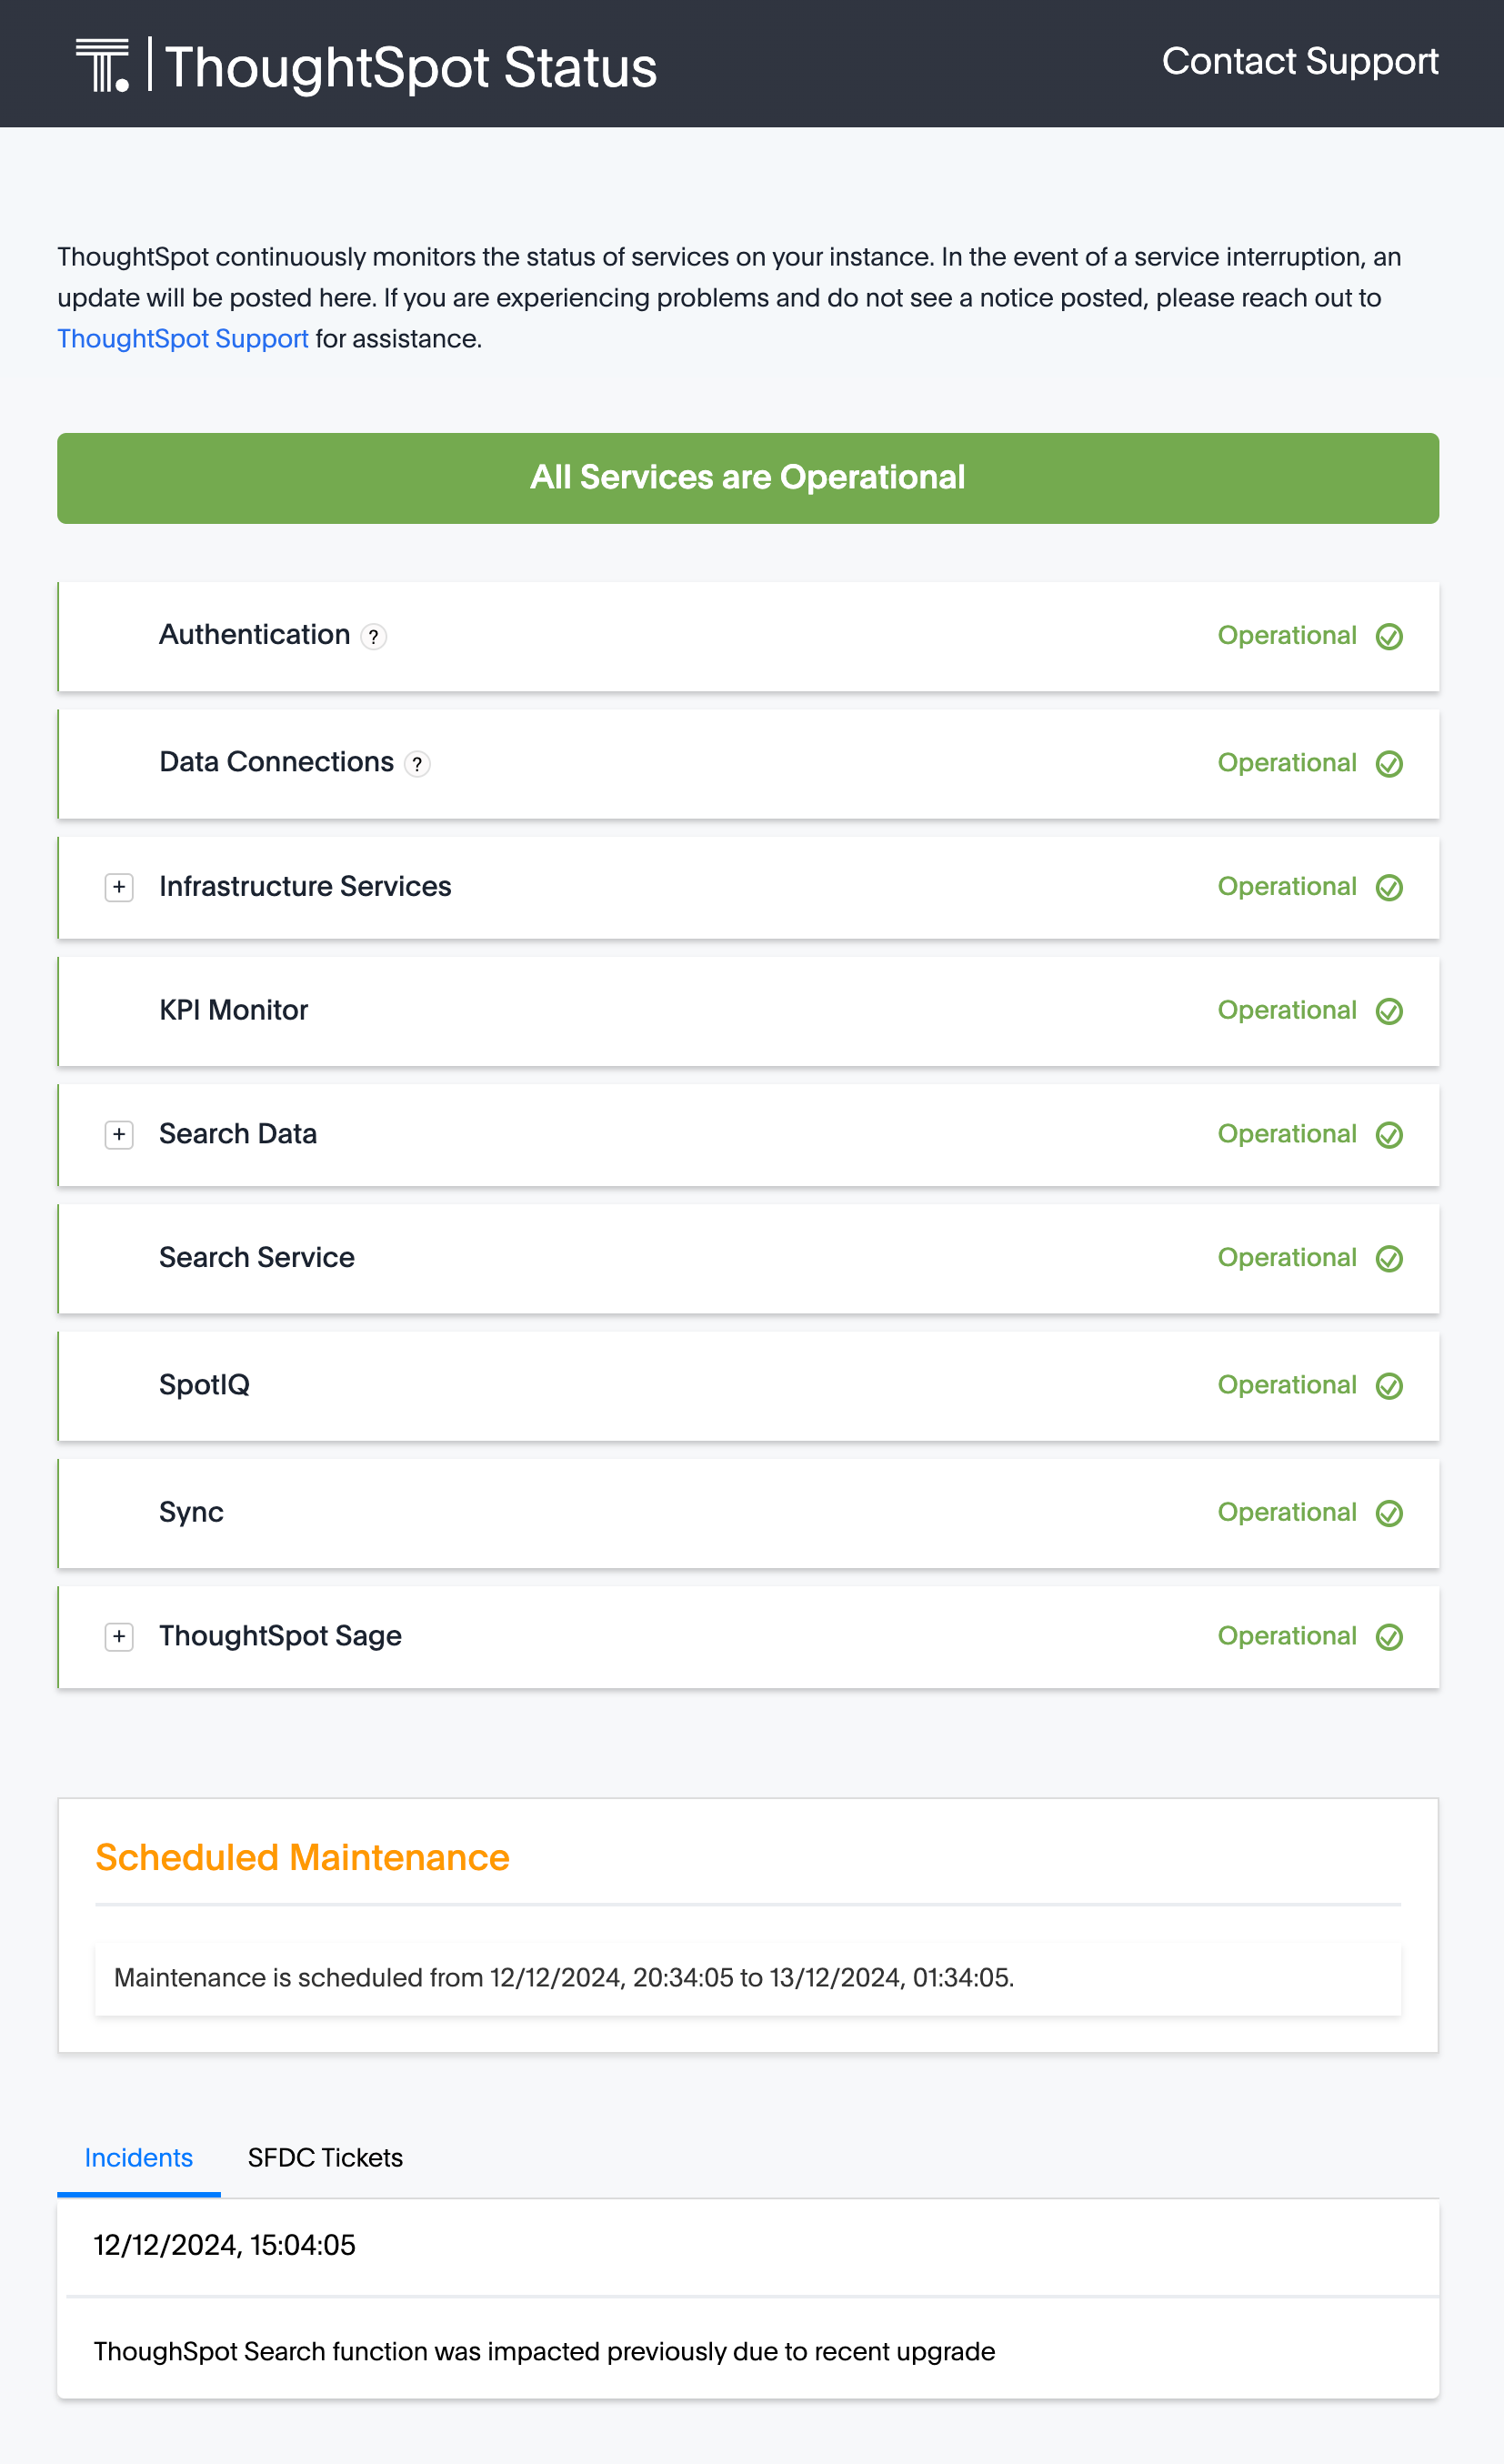
Admin users can now navigate to the ThoughtSpot Status page to monitor the health of services on their cluster. The Status page displays the status of different ThoughtSpot services, like Authentication, Data Connections, Infrastructure Services, KPI Monitor, Search Data, Search Service, SpotIQ, Sync, and Spotter. The page also shares scheduled maintenance timelines, outage notifications, and incident reporting and updates.
To access the status page, add /status to the end of your cluster url (for example, https://<clustername>.thoughtspot.cloud/#/status). To enable this feature, contact ThoughtSpot Support. For more information, see
Status page.
Version control permissions
We made the following changes to permissions regarding version control:
-
Admin users can now assign the Can set up version control privilege to allow non-admin users to access the version control settings under Admin > Application settings, and to use Version Control REST v2 APIs.
-
We renamed the previous Can manage version control permission to Can toggle version control for objects. Users with this permission and edit access to a ThoughtSpot object can enable or disable version history for that object.
For more information, see Version control for Liveboards and Answers.
Data panel column groups
Analysts can now set definitions in a Model’s TML file to group columns together in the Data panel for Search Data. You can also use TML properties to enable or disable alphabetical sorting of the groups. For more information, see TML for Models.

Download custom calendar
In the Create a custom calendar interface, you can now set up a template calendar and download it as a CSV file with all columns, based on the values you inputted. You can then modify the file and share it with your ThoughtSpot administrator to upload it to your database. Once the CSV is uploaded to the database, you can set up the calendar by directly mapping the table. For more information, see Create a custom calendar.
Utilities schema viewer connection picker Early Access
ThoughtSpot introduces a connection picker to the schema viewer. You can now use the dropdown or search to select your connection in the schema viewer.
| You can no longer view objects across all connections. You must filter by a specific connection. For more information, see Schema viewer connection picker. |
For the Developer
For new features and enhancements introduced in this release of ThoughtSpot Embedded, see ThoughtSpot Developer Documentation.


