Area charts
The area chart is based on the line chart, but has filled in regions.
Area charts display quantitative data graphically. The areas between the x-axis and the line are colored in to help you compare different portions of the chart.
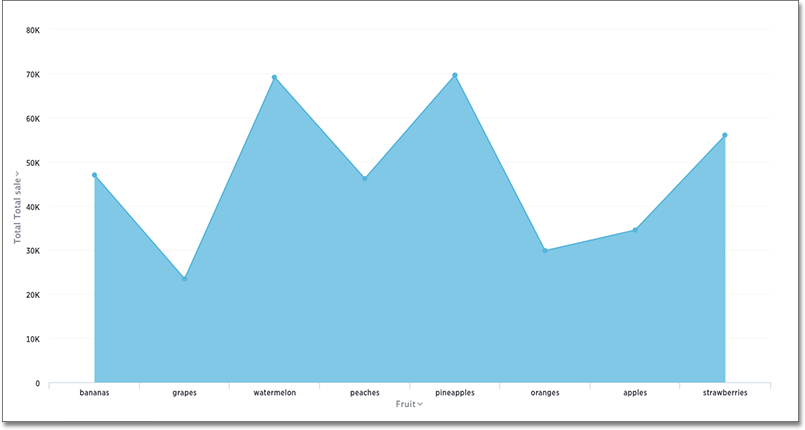
Your search needs at least one attribute and one measure to be represented as an area chart.
See also Stacked area charts.
Was this page helpful?Give us feedback!


