Funnel charts
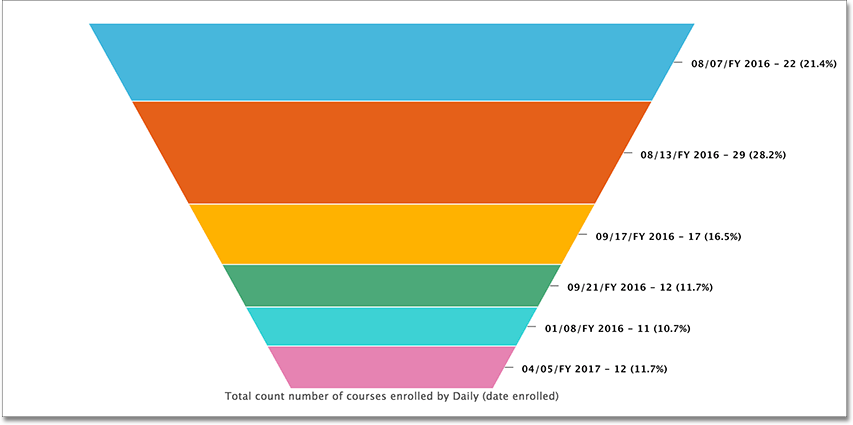
The funnel chart shows a process with progressively decreasing proportions amounting to 100 percent in total. A funnel chart is similar to a stacked percent column chart, and is often used to represent stages in a sales process.
You can visualize the progression of data as it passes from one phase to another. Data in each of these phases is represented as different proportions.
Your search needs at least one attribute and one measure to be represented as a funnel chart. The attribute must contain 50 or fewer values.