Spotter change analysis
It can be difficult to understand the root cause of trends and anomalies in your data. This can lead to inefficient analysis and suboptimal decision-making.
Spotter change analysis allows you to ask "why" questions on any chart. Spotter breaks the question down into three sub-questions based on the top three attributes relevant to the analysis. Spotter then analyzes the top contributors for each attribute value and reports the findings. At the end of the analysis, Spotter provides a summary to help you understand the changes overall and dive deep into a specific analysis you find useful.
Enable Spotter change analysis
To enable Spotter change analysis, follow these steps:
-
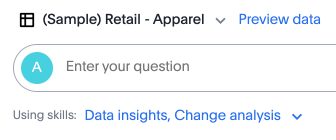
Open Spotter and scroll to the Using skills section of the Search bar.
-
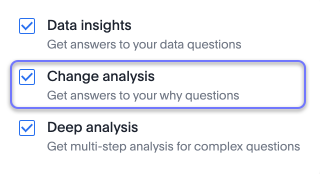
Ensure the Change analysis skill is selected.
Spotter change analysis example
Let’s say you see a decrease in sales from December to January on a line chart, you can ask the following question: Why did sales decrease from December to January?. Spotter breaks down the question into three sub-questions based on the top three attributes:
-
Item type: What types of items were most affected by the sales decrease?
-
Region: Which regions experienced the largest sales decrease?
-
Store: Which stores had the biggest drop in sales?
The Spotter agent then analyzes the top contributors for each attribute value and reports the findings to you. For example, Spotter might find that the sales decrease shows that winter clothing saw the largest decrease in Item type.


