Spotter Conversations Liveboard
Use the Spotter Conversations Liveboard to get insight on how your users are interacting with Spotter. You can gain insight into user engagement and adoption metrics for Spotter, track query trends and understand user intent, monitor follow-up actions (including query refinements and edits within conversations), and analyze feedback to identify training gaps and improve dataset coverage.
|
We have made the following changes to the TS: Spotter Analytics Model, which the Spotter Conversations Liveboard is based on:
|
Accessing the Liveboard
You must have admin privileges to view this Liveboard.
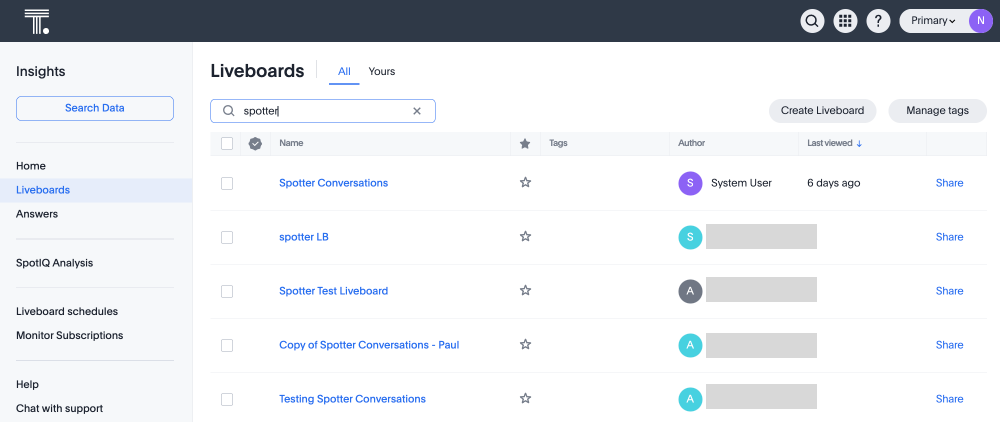
To view this Liveboard, navigate to the Insights tab, select Liveboards from the left menu, and search for Spotter Conversations.
| The Spotter Conversations Liveboard is now available in all Orgs. In the primary Org, only administrators have access by default. |
Navigating the Liveboard
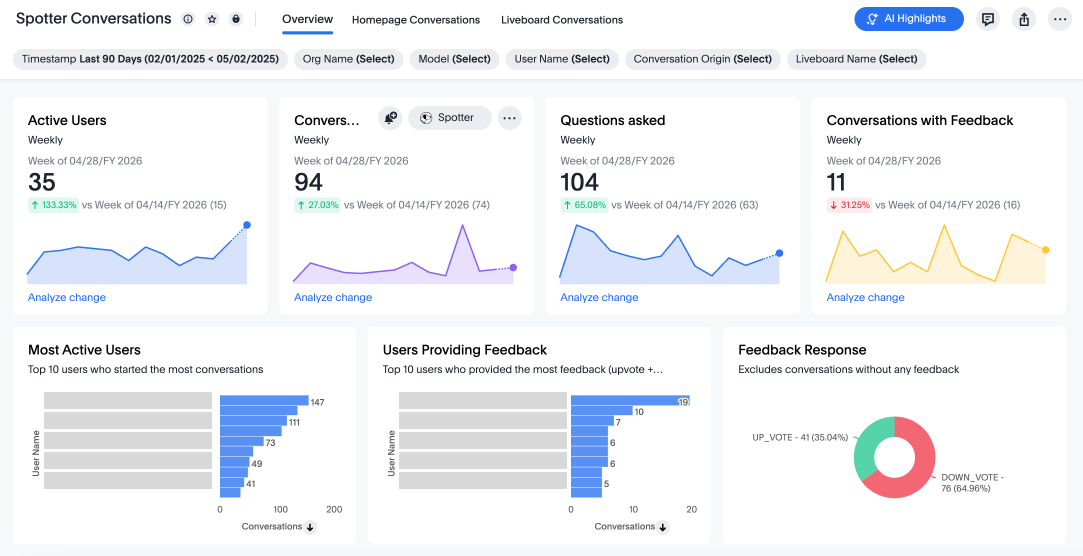
You can filter the Liveboard by timestamp, Org, Model, conversation origin, and user name using the filters at the top of the Liveboard.
Understanding the metrics
This Liveboard provides insight into the following key areas:
Overview Metrics
-
Active users (weekly): Shows the number of users actively engaging with Spotter.
-
Conversations (weekly): Tracks the total number of Spotter conversations that users had.
-
Questions asked (weekly): Shows the number of questions asked.
-
Conversations with feedback (weekly): Indicates the number of conversations where users either downvoted or upvoted a response.
-
Most active users: Identifies users who have had the highest number of conversations on Spotter.
-
Users providing feedback: Identifies top 10 users who provided the most feedback (upvote and downvote).
-
Feedback Response: Shows ratio of upvotes and downvotes in conversations where users gave feedback.
-
Conversations by origin: Indicates whether the majority of conversations begin on the home page or on a Liveboard.
-
Conversations by Model: Highlights which Models are used most frequently.
-
Conversations by Liveboard: Highlights on which Liveboards the most conversations are started.
-
Avg Conversation Length: Identifies the average number of questions asked in a conversation.
-
Conversation length distribution: Displays a frequency distribution of the number of questions asked in a conversation.
Homepage and Liveboard Conversations
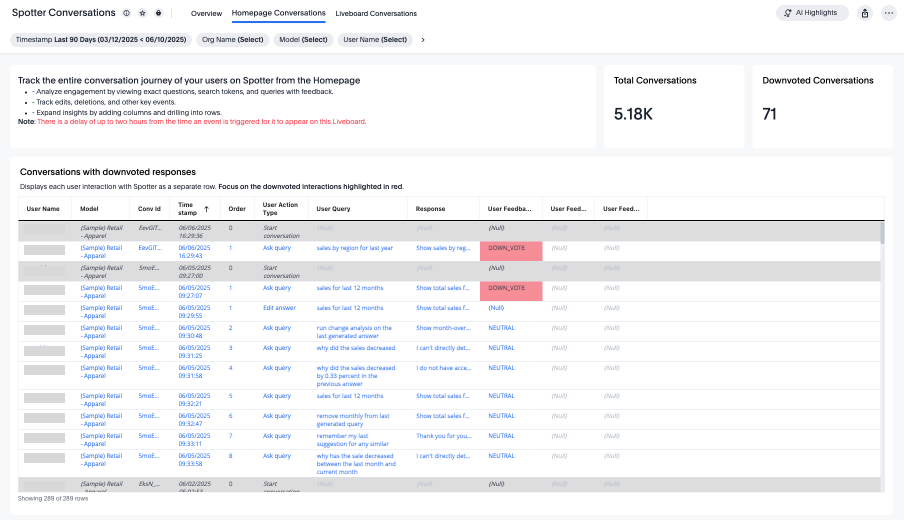
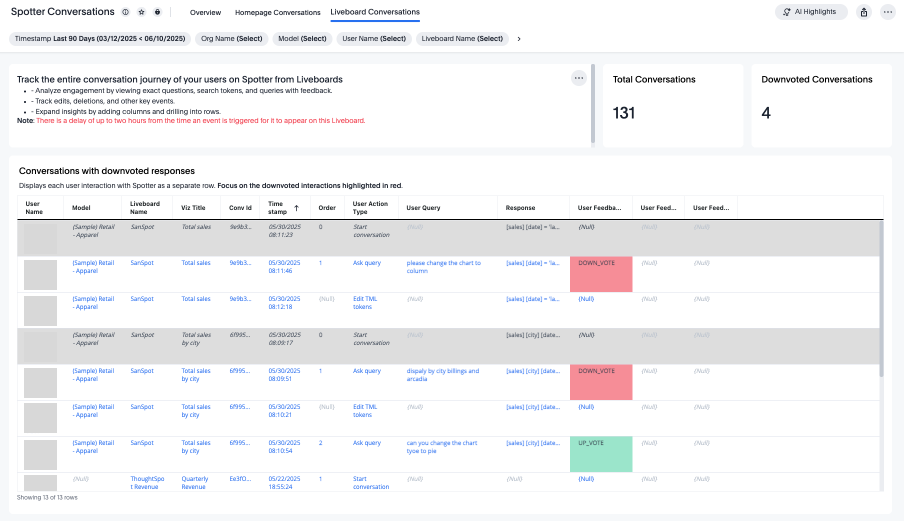
Switch between the Homepage and Liveboard Conversations tabs to see the following fields, separated by origin of the conversation:
-
Total conversations: Overall volume of Spotter interactions on Liveboards or the home page.
-
Downvoted conversations: Total number of conversations where users downvoted a response, indicating a need for coaching.
-
Conversations with downvoted responses: Displays a log of user interactions in downvoted conversations, sorted by timestamp. The most recent conversations appear at the top.
-
Complete conversations log: Shows every user interaction as a separate row, sorted by timestamp, with the most recent interactions appearing first.
Data retention
- What’s changing
-
We are streamlining the Conversation Liveboard experience and making it inline with the chat history. Each event recorded in the Spotter Conversations Liveboard will have a 180-day retention window, counted from the date the event is recorded. In early July 2026, ThoughtSpot performs an initial cleanup that removes events older than 180 days; after that, events are removed automatically once they reach 180 days, on a rolling basis. This brings Conversations Liveboard data retention in line with the 180-day retention already used for Spotter chat history.
- What you need to do
-
If you need to keep Liveboard records beyond 180 days — for example, for auditing or long-term trend analysis — export the data from the Spotter Conversations Liveboard as a CSV or Excel file before the July 2026 cleanup. Once an event passes its 180-day window, it cannot be recovered.
| This applies only to data in the Spotter Conversations Liveboard. Administrators can also request, through support, to disable the pipeline. |
Best practices for using the Liveboard
Follow this structured workflow to analyze data and take action:
-
Start with overview metrics.
-
Review active users, conversation trends, and feedback volume to understand general engagement.
-
-
Identify issues and patterns.
-
Look at downvoted responses and refinements to identify problematic areas.
-
-
Take action.
-
Adjust Spotter coaching, refine data sets, or offer user training and guidance to improve AI performance.
-
-
Monitor long-term impact.
-
Use trend analysis to measure improvements in AI accuracy and adoption over time.
-