Why questions in Spotter
When you want to investigate further on a chart in Spotter, you can now ask direct questions like, "Why did my sales drop last month?" or "Why did sales drop in Q2?" Spotter identifies the key attributes and leverages the change analysis engine to provide a clear, natural language summary identifying the key drivers, supported by detailed visualizations. You can easily investigate changes in your data, moving from surface-level observations to insights in the same conversation.
| Enabling this feature allows Spotter to send query-related data, such as the involved metrics and dimension values (like "sales" or "region = West"), to an LLM to identify the data points and generate explanations. Please ensure this complies with your organization’s policies. The data is not utilized for model training, and we maintain a zero-data retention policy with all our LLM providers. |
| Why questions are enabled by default for instances using Spotter 3. |
Ask a why question
You can build upon an existing surface-level query or existing visualization by choosing a data point of interest and asking a natural question starting with “Why”. Spotter uses change analysis to answer why questions about a single metric on simple, non-sliced charts. Below are a few examples:
- Why has the revenue dropped?
-
Identifies the revenue metric, picks up the last two date points to identify the key change drivers.
- Explain the change in website traffic last week compared to the week before.
-
Compares the website traffic metric for this week versus the previous week.
- Why are churn rates higher in East than West?
-
Compares the churn metric in East and West.
Why question process
Here’s an example for asking why questions in Spotter:
-
Start with a visualization: Begin with a chart in Spotter that shows a metric you’re interested in, such as your monthly sales. Or launch Spotter from a visualization in a Liveboard that has a metric.
-
Ask why: When you notice a change, like a drop or a spike, simply ask a natural language question in the search bar. For example, after seeing a chart of monthly sales, you could ask, “Why did sales drop last month?”
-
Review the analysis: Spotter performs change analysis and presents the findings in a structured manner:
-
Analysis plan: Spotter first explains how it understands your question and which attributes it will analyze to find the answer.
-
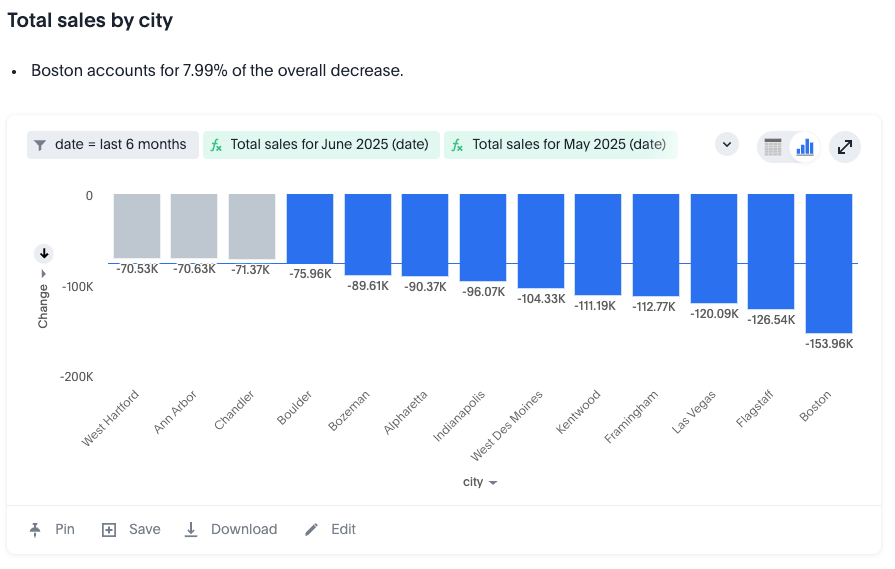
Detailed visualizations: Spotter then provides detailed change analysis charts that break down the contributions from different attributes.
-
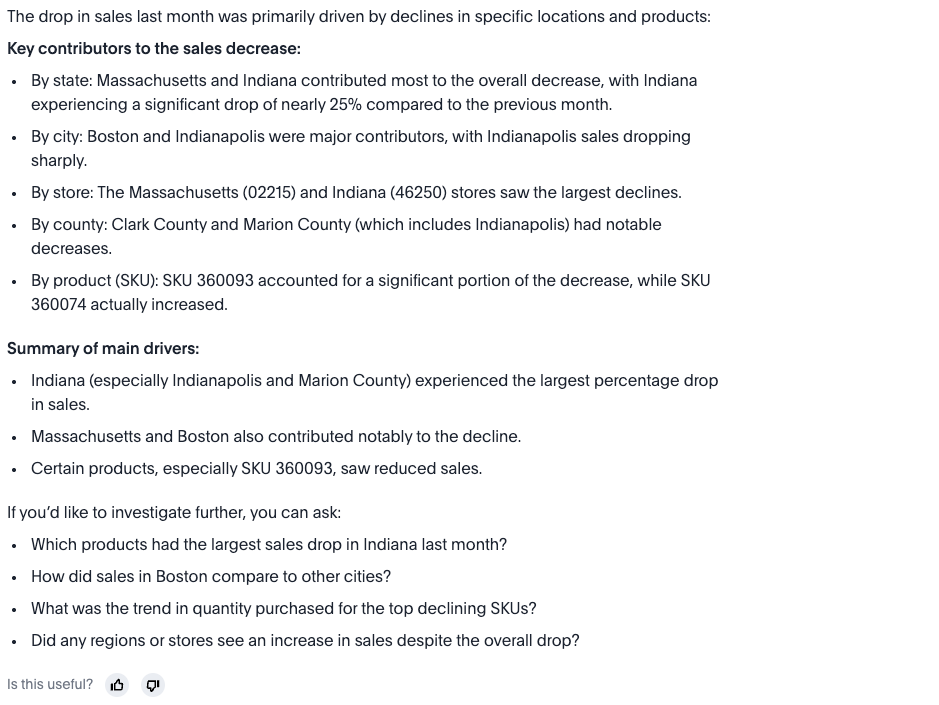
Narrative summary: Finally, Spotter provides a concise, natural language summary of the key drivers so you can quickly understand the main takeaways.
-
Limitations
Why questions in Spotter have the following limitations:
- Data granularity
-
This feature may not work as expected if the x-axis has a very high number of data points (for example, >1000).
- Change analysis
-
Spotter does not support change analysis for queries based on the
growth ofandversus(vs) keywords. Change analysis is not supported on certain complex formulas based upon group_* functions (such assum(group)orsum(x)/ group_*). Simple functions that only usegroup_*are supported. - Personalized columns
-
If you have set up personalized columns in a KPI chart, then ask a why question of the chart in Spotter, Spotter chooses columns based on usage-based ranking to answer, rather than your selected columns.