Creating charts with Muze Studio
Muze Studio is a code execution sandbox built into ThoughtSpot. It lets you create fully custom charts directly inside an Answer — going beyond ThoughtSpot’s native chart types — without leaving the ThoughtSpot interface.
Muze Studio can execute and render three types of chart code:
-
Muze syntax — Use ThoughtSpot’s in-house charting library, Muze, to build composable, layered charts using the code written in Muze syntax. For an introduction to the Muze library, see Introduction to Muze.
-
Custom JavaScript, CSS, and HTML — Write standard web code to render any visualization without relying on a specific charting library.
-
Third-party charting libraries — Import and use browser-compatible libraries such as Chart.js or D3.js to render any chart type your use case requires.
You can also browse and use any of the available charts in the Muze chart gallery. For more information, see Muze chart gallery.
| Charts created in Muze Studio are associated with an individual Answer. Other users can copy the Answer and modify it to reuse the same chart. |
The code editor
The Muze Studio code editor has four components:
-
JavaScript editor — Render charts using the Muze API, custom JavaScript, or a third-party library. The following APIs and data are available:
-
Muze library: The full Muze API for composing chart layers, cross-canvas interaction, and more.
-
Data and DataModel: Data from your ThoughtSpot search query is available directly. Use Muze’s in-memory DataModel component to apply filters, group-by operations, and selections before rendering.
-
Color palettes: Use the color API to match the color styles used across ThoughtSpot. By default, your chart inherits the instance-wide color palette.
For more information, see Muze API reference.
-
-
CSS editor — Style your chart using CSS classes.
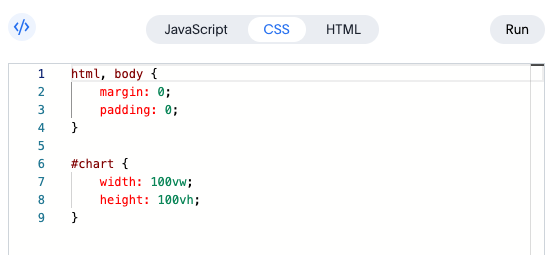
For details, see Styling your charts.
-
HTML editor — Define the chart container, structure the layout, and add elements such as annotations. The
<div>tags you add here define where the visualization renders.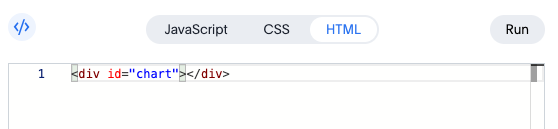
Click Run at any time to preview your changes in the chart preview pane.
Getting started
To create a chart using Muze Studio:
-
Navigate to an Answer in ThoughtSpot.
-
Click the chart type selector.
-
Select Muze Studio from the list of chart types.
-
Once the code editor panel opens, use the custom JS/CSS/HTML, or a third-party library to write code manually.
-
Click Run to preview your changes.
-
To save, click the More menu
 and select Save.
If your Answer is pinned to a Liveboard, click Pin to publish your changes.
Migrating from Muze Studio (version 10.14.0.cl and earlier)
If you created charts using Muze Studio in version 10.14.0.cl or earlier, ThoughtSpot recommends migrating to native Muze charts to resolve known limitations with exports, scheduled reports, version control, and formatting.
Native Muze charts are available by default in the chart type selector from version 26.2.0.cl onwards.
To migrate a chart:
-
Open the Answer containing the chart.
-
Click the chart type selector.
-
Select a chart type from the New section.
ThoughtSpot automatically transfers the chart code to the native Muze chart type. Note that some configurations may not carry over during the migration.
-
Click Save.
|
If your Muze Studio chart uses custom JavaScript or imports a third-party library via an HTML This line is required when using custom JavaScript or third-party libraries. It signals to ThoughtSpot that chart rendering is complete, which is necessary for exports, scheduled reports, and other services to work correctly. For more information, see Charts built with third-party libraries. |