Getting started with Analyst Studio
Analyst Studio’s analyst-first approach uses familiar technologies like SQL, Python, and R in an interactive data science environment that augments BI workflows in ThoughtSpot. This guide will give you information about how to get your team using Analyst Studio’s broad suite of capabilities.
Analyst Studio hosting location:
-
United States
Data access and user roles
User access
Users can be given access to perform their analysis or administrative tasks in Analyst Studio. Users and user groups can be given access by assigning can use Analyst Studio privilege to give them access to Analyst Studio or can manage Analyst Studio privilege to be an admin. An admin user is necessary for establishing database connections, creating Collections, and managing Report access. We recommend granting several users admin privileges. Once a user has been made an admin, they can perform actions such as:
-
Establish database connections.
-
Create Collections.
-
Restrict Report visibility and access.
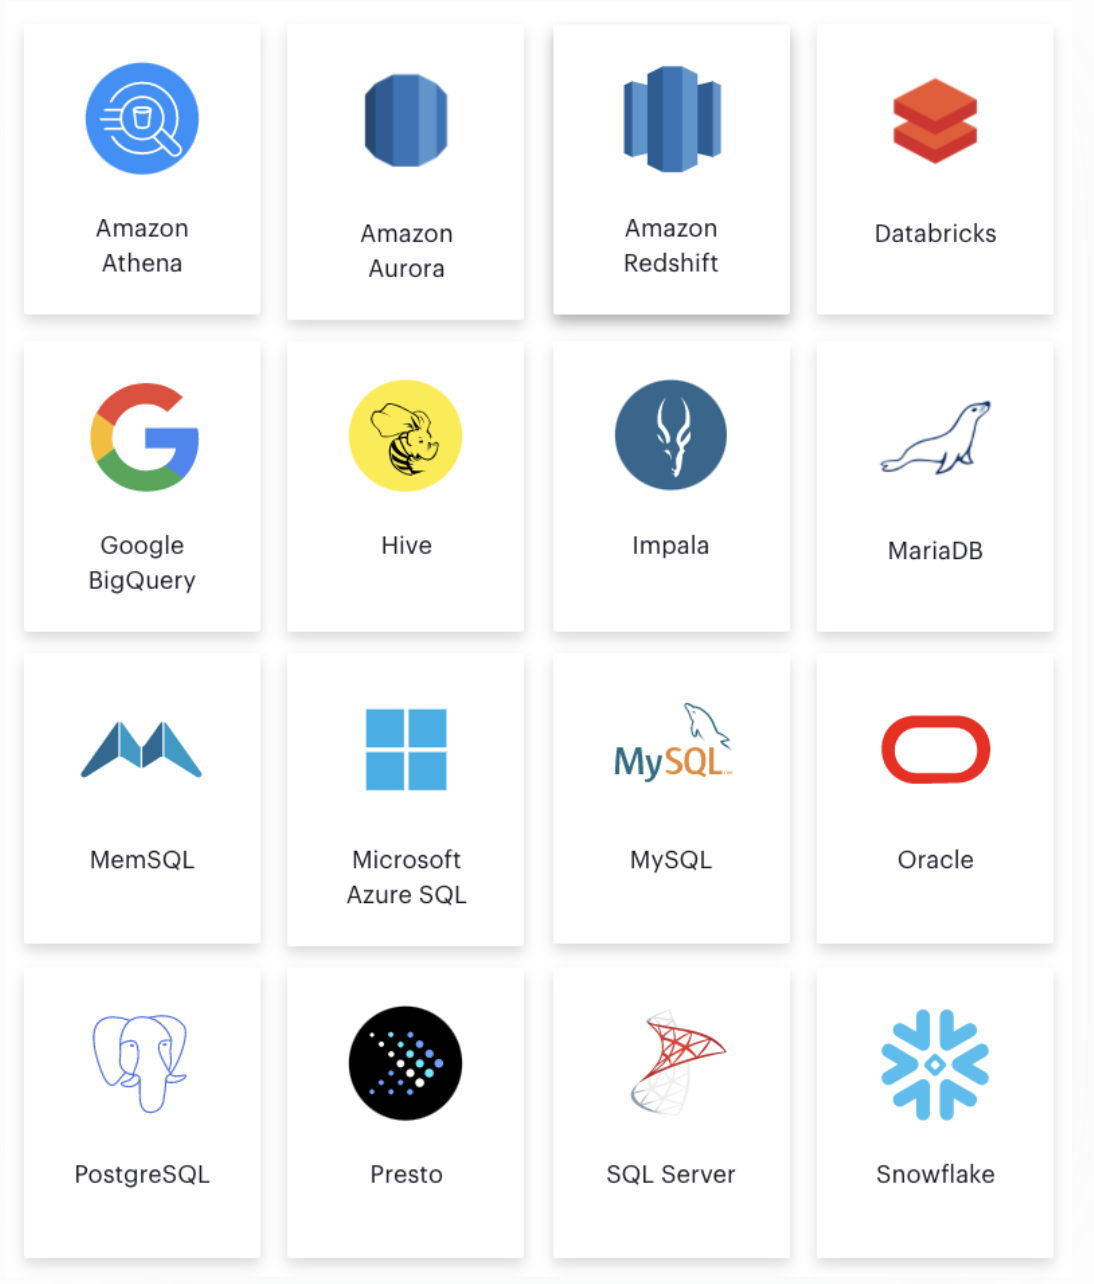
Connect to a database
Analyst Studio can directly connect to many popular databases. All you have to do is enter the appropriate security credentials. A direct connection is easy to set up and does not require IT resources. If a database is behind a firewall or only accessed via VPN or VPCs, Analyst Studio supports a bridge connector option that’s easy to install, configure, and maintain. The bridge connector can run directly behind your organization’s VPN or firewall and once it’s installed, can be configured to securely connect to one or more of the databases within your company.
Create Collections
With Analyst Studio’s user and sharing models, all users have access to existing reporting assets through Collections. You can use your personal Collection to keep track of your work. When you are ready to share the analysis with others, you can make the results available in an open Collection or share it privately with a specific group of users.
Using shared private Collections, your team can keep Reports organized, grouping them by project, department, quarter, or data source.
SQL editor
The first step in creating a Report is to query data using the query editor. Analyst Studio’s SQL Editor provides flexibility without extra complexity. The editor is simple and intuitive while providing advanced capabilities to streamline workflow.
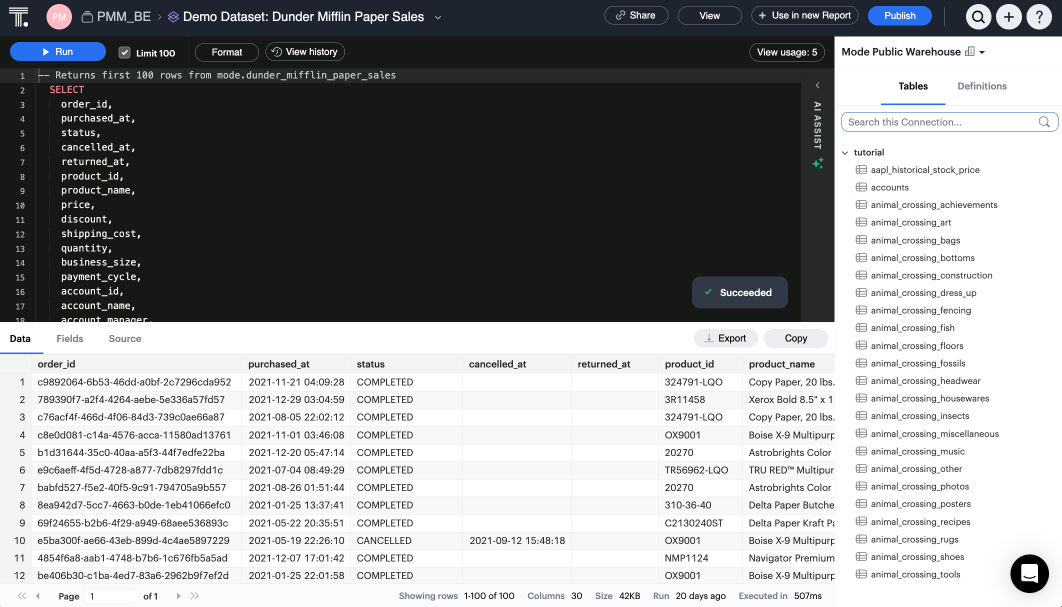
Select the database and explore the schema with the schema browser. The schema browser shows table structures, including column names, data types, and samples of actual data, in a simple table view. For databases with many tables, you can use the search functionality or pin tables to the top of the browser to more easily focus on the task at hand.
The code editor is where the analyst writes SQL to query the databases. The editor provides developer-friendly features, including:
-
Code highlighting and formatting.
-
Keyboard shortcuts.
-
Context-aware auto-complete.
-
Query history.
Time-saving shortcuts for your queries
Definitions
To save time, you can templatize your SQL queries with shared Definitions.
These are custom SELECT statements that can be referenced in any SQL query.
These Definitions allow users to write business logic in one place and share it across multiple Reports and users—simplifying complex queries, reducing repetitive tasks, and ensuring consistency.
Liquid template language
Liquid template language is available in all SQL queries and allows additional flexibility on top of existing SQL queries. With the template language, analysts can augment SQL with loops, if/then statements, and variables. These simple template constructs can simplify many tasks that are difficult to do within base SQL.
Helix data engine
Behind the scenes, Analyst Studio’s in-memory data engine, Helix, powers the data analysis process. Instead of doing last-mile aggregations and pivots in queries to fit the results in memory, Helix lets analysts do the calculations on the fly using calculated fields directly in the Report — reducing work and saving time. Because Helix works with large datasets, analysts can get insights on large datasets in less than an hour. Helix needs no configuration or tuning. You will have this feature available upon implementation.
Analyst Studio’s SQL Editor is a powerful enabler for all users in your company. It is easy to use because it leverages basic SQL to get started, but offers features that can accelerate the work of your entire team.
Visualizations
After an analyst creates a SQL query to retrieve data from the database, they have several options to further analyze and share the resulting dataset through visualizations. The simplest approaches are to display the data in a table, export to CSV, or copy to the clipboard. These static export options are useful for quick analysis. Analyst Studio, however, provides a much richer toolset for analyzing and sharing data with others through pivot tables and charting capabilities.
Tables
The simplest visualization is a table view of the data. In the table view, you can identify the dimensions and measures for your Reports as well as the end-user filters. You can also control the format of your data so that, for example, the currency, date, and percentage columns are readable and understandable.
Chart visualizations
Chart visualization options include bar, line, scatter, area, and pie charts. These chart types let end-users increase or decrease the granularity of the Report, and are simple to construct using the Analyst Studio interface. For example, you can explore a sales Report and look at the data on a daily, monthly, or annual basis by adjusting the granularity. If there is an interesting observation, you can drill down into the weekly or daily data to view the underlying data table supporting the Report.
Custom visualizations
With Analyst Studio, you can create your own custom visualizations as well. One of the primary ways of doing so is by leveraging the R and Python visualization libraries through the notebook environments.
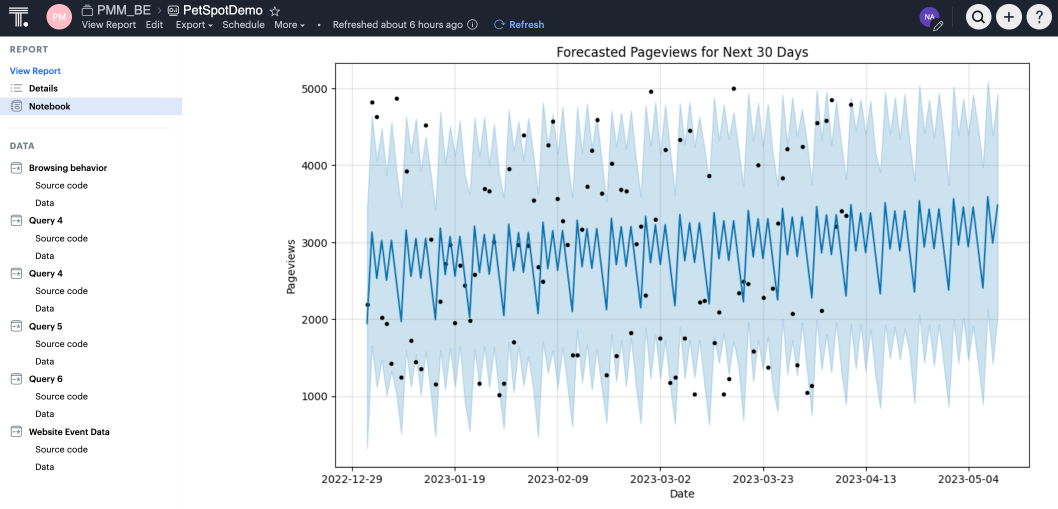
Notebooks
So far, we’ve covered the SQL Editor and visualization tools which are good for day-to-day analysis. Most companies, however, need an environment where users can execute their own Python or R scripts against the data in order to perform further visualizations. Your users can use Analyst Studio’s SQL Editor and visualization tools for day-to-day analysis.
Analyst Studio uses industry standard Python and R in a notebook environment to enable rapid code iteration for data manipulation, statistical analysis, and advanced visualization. An analyst can perform analysis in a notebook that might be difficult (or impossible) to do in SQL.
Analyst Studio’s Notebook has specific advantages, including its ease of setup, centralization of environments, and simplified administration due to the inclusion of a variety of preloaded Python and R libraries. Since this environment is very similar to existing notebook environments, the learning curve should be minimal.
After a query has been created using the SQL Editor, a user can add a new Notebook to their Report and access the results of all queries. Each query’s result is available in the native Pandas Data Frame or R Data Frame.
No additional manipulation is necessary. Because queries across multiple databases are made available in the Notebook, it can be used to merge data that can not be easily joined with a standard SQL query. The analyst can then use the full suite of data science tools in Python or R to clean, analyze, and visualize the data.
Out of the box, Analyst Studio includes many of the most popular libraries for R and Python, but if you need to install additional libraries, you can use pip install for Python or install.packages() with R.
Combined, the SQL Editor, visualization features, and Notebook environments in Analyst Studio enable users to create quick, flexible, and shareable analysis.