AI and BI System Liveboard
Use the AI and BI Stats System Liveboard in ThoughtSpot Cloud to monitor query usage and analyst activities across all Orgs. It joins Query Stats with Analyst Studio data to provide comprehensive visibility into product usage, adoption, and billable queries.
Metrics are directly tied to query logs, reducing ambiguity and ensuring precise reporting. Use this Liveboard to understand daily, weekly, monthly, quarterly, annual and total active query users, monthly objects volume and so on. You must have admin privileges to view this Liveboard.
Users with admin privileges can share system Liveboards, such as the AI and BI Stats Liveboard, with other users who do not have admin privileges. However, be aware that you may be sharing sensitive user-level information, such as the names of objects that a user accessed.
To view this Liveboard:
-
Go to the Admin tab.
-
Choose System Activities.
-
Select the AI and BI Stats, or search for AI and BI Stats.
Use the Liveboard
You can filter the Liveboard by user, group or Org from the filter bar underneath the Liveboard name.
|
The Provisioned users KPI will not reflect the Org specific data by using only the Org filter available on the Liveboard. To be able to see the number of Provisioned users for a specific Org, use the Provisioned Users data model. |
Use this Liveboard to view and analyze information about the following topics:
Before you begin
To access the AI and BI Stats Liveboard and its underlying data model, confirm the following requirements:
-
You must have the Administrator role, or a role that includes the Can manage system privilege.
-
If your ThoughtSpot deployment uses Orgs, you must have Primary Org administrator access to view data across all Orgs. Org-level administrators can view usage data for their own Org only.
-
The TS: AI and BI stats data model must be shared with your user or group. Non-admin users require explicit access to both the Liveboard and the data model.
|
Sharing a Liveboard authored by a System User (such as AI and BI Stats or Spotter Conversation) with non-admin users requires that the user also has direct access to the underlying data model. If a non-admin user sees a Request Access message, verify that the TS: AI and BI stats model has been explicitly shared with that user or group. |
Overview
Track overall query activity and user engagement across your ThoughtSpot instance. Monitor active user counts across all time periods and identify the most-used content.
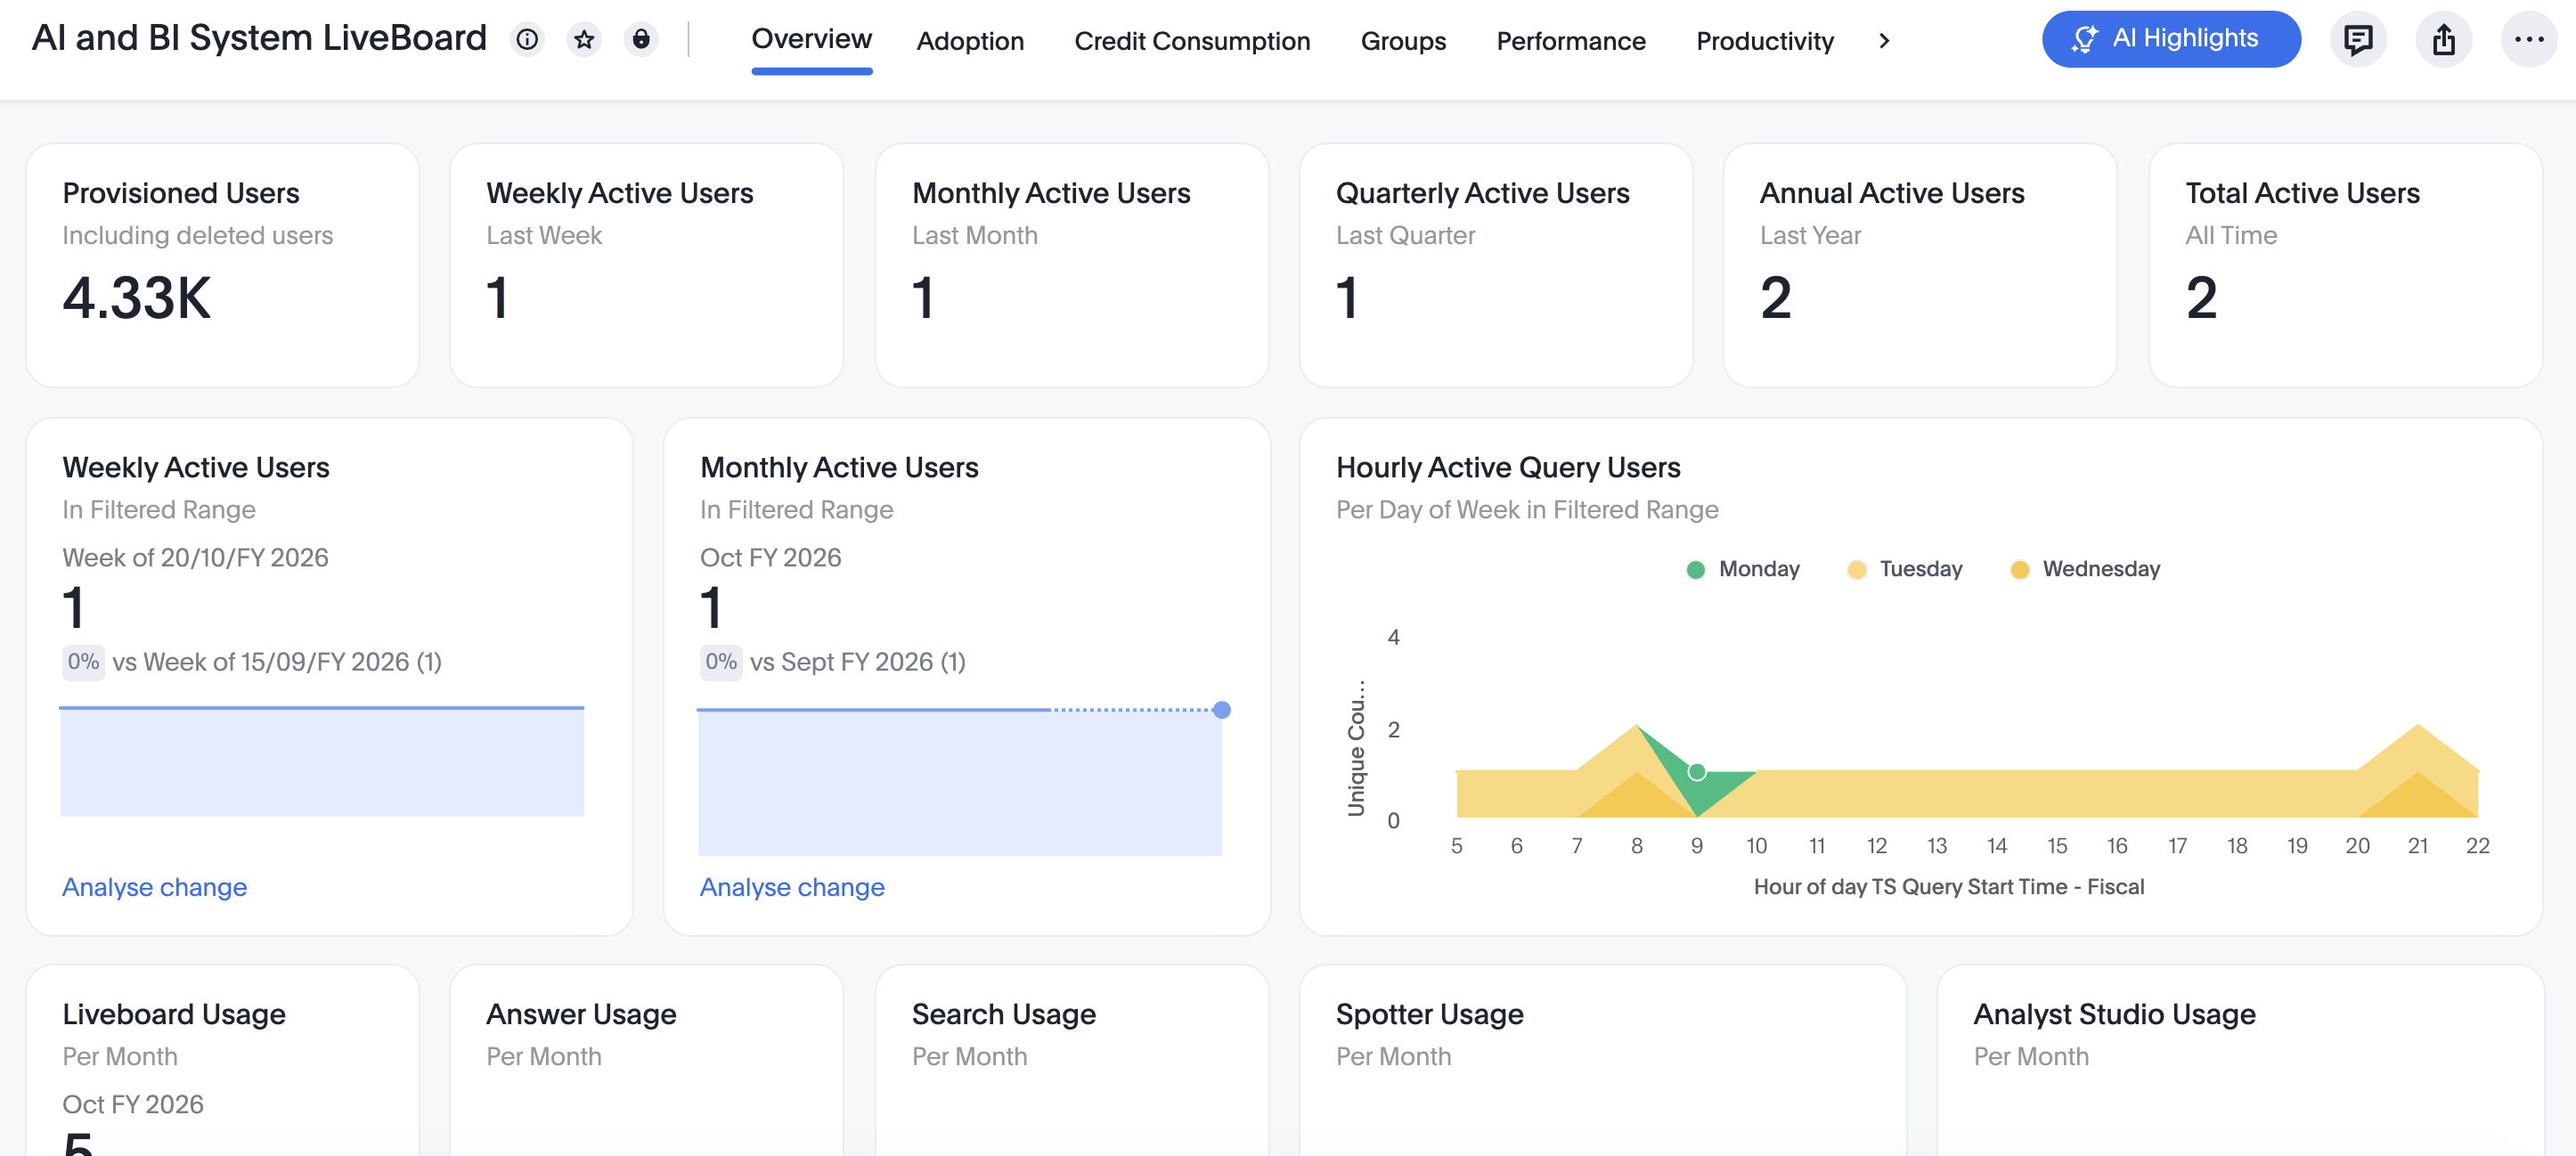
-
Number of users, active and inactive, provisioned for an instance at any given time (Provisioned Users)
-
Weekly, monthly, quarterly, annual and total active query users (Weekly Active Query users, Monthly Active Query users, Quarterly Active Query users, Annual Active Query users, Total Active Query users)
Users are compared against the immediate preceding period, which means this week vs. last week, this month vs. last month.
-
Weekly Active Users, Monthly Active Users in Filtered Range is a filtered range comparison of unique users on a Month-to-Date (MTD) basis.
-
Number of unique queries made in each hour of the day, for every day from Monday to Sunday in the most recent week (Hourly Active Query Users, Per Day of Week in Filtered Range)
-
Number of unique Liveboards used over the month (Liveboard Usage)
-
Number of unique Answers used over the month (Answer Usage)
-
Number of unique Searches used over the month (Search Usage)
-
Number of unique Spotter queries used over the month (Spotter Usage)
-
Top 20 Models, Liveboards and Answers at the time when the user is viewing the Liveboard (Top 20 Models, Top 20 Liveboards, Top 20 Answers)
Adoption
Understand how users are engaging with ThoughtSpot content over time. Track Liveboard impressions, data exports, and top contributors.
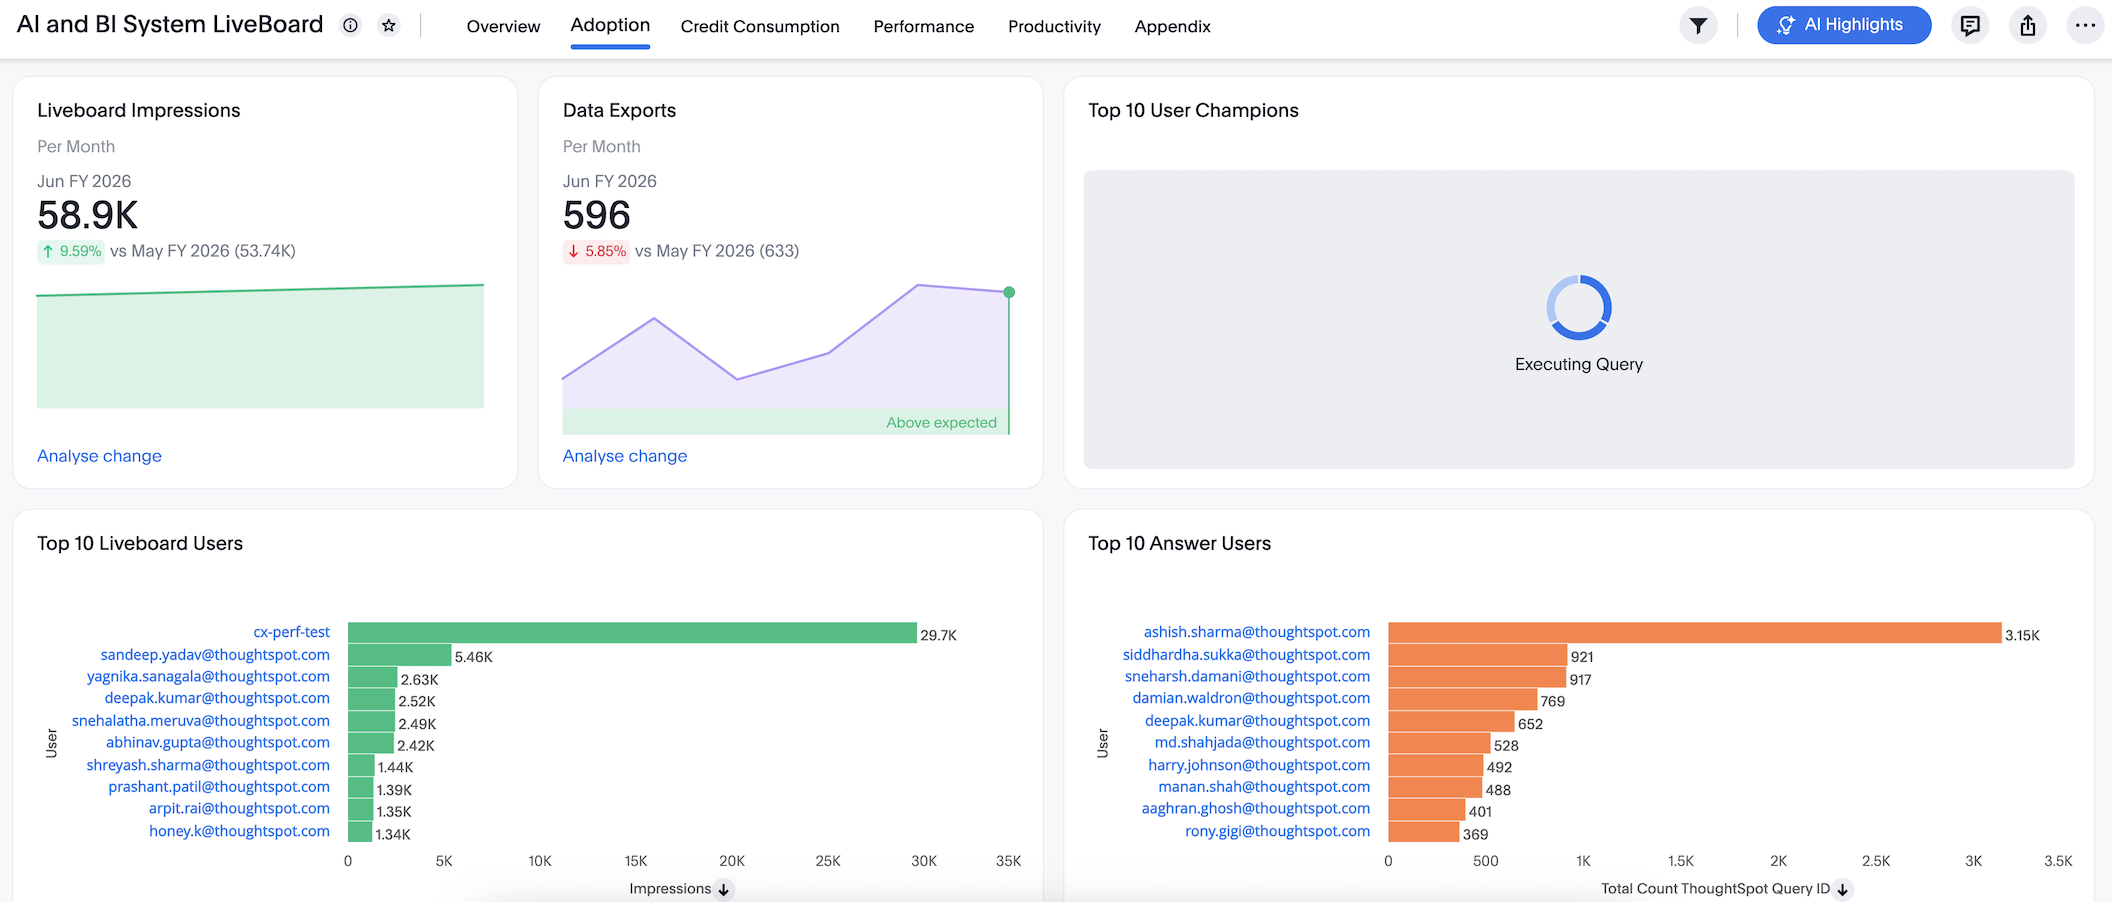
-
Monthly unique Liveboard impressions (Liveboard Impressions)
-
Monthly users exporting data from the ThoughtSpot application (Data Exports)
-
ThoughtSpot users leaderboard (Top 10 User Champions)
-
Monthly Liveboard users leaderboard (Top 10 Liveboard Users)
-
Monthly Answer users leaderboard (Top 10 Answer Users)
-
Total Spotter users leaderboard (Top 10 Spotter Users)
-
Total Search users leaderboard (Top 10 Ad-hoc Search Users)
-
Users with the maximum daily activity across the ThoughtSpot application (Top 50 Power Use Engagement)
Credit Consumption
Monitor credits consumed by all query activity across your instance. Track cumulative and monthly credit usage by activity type.
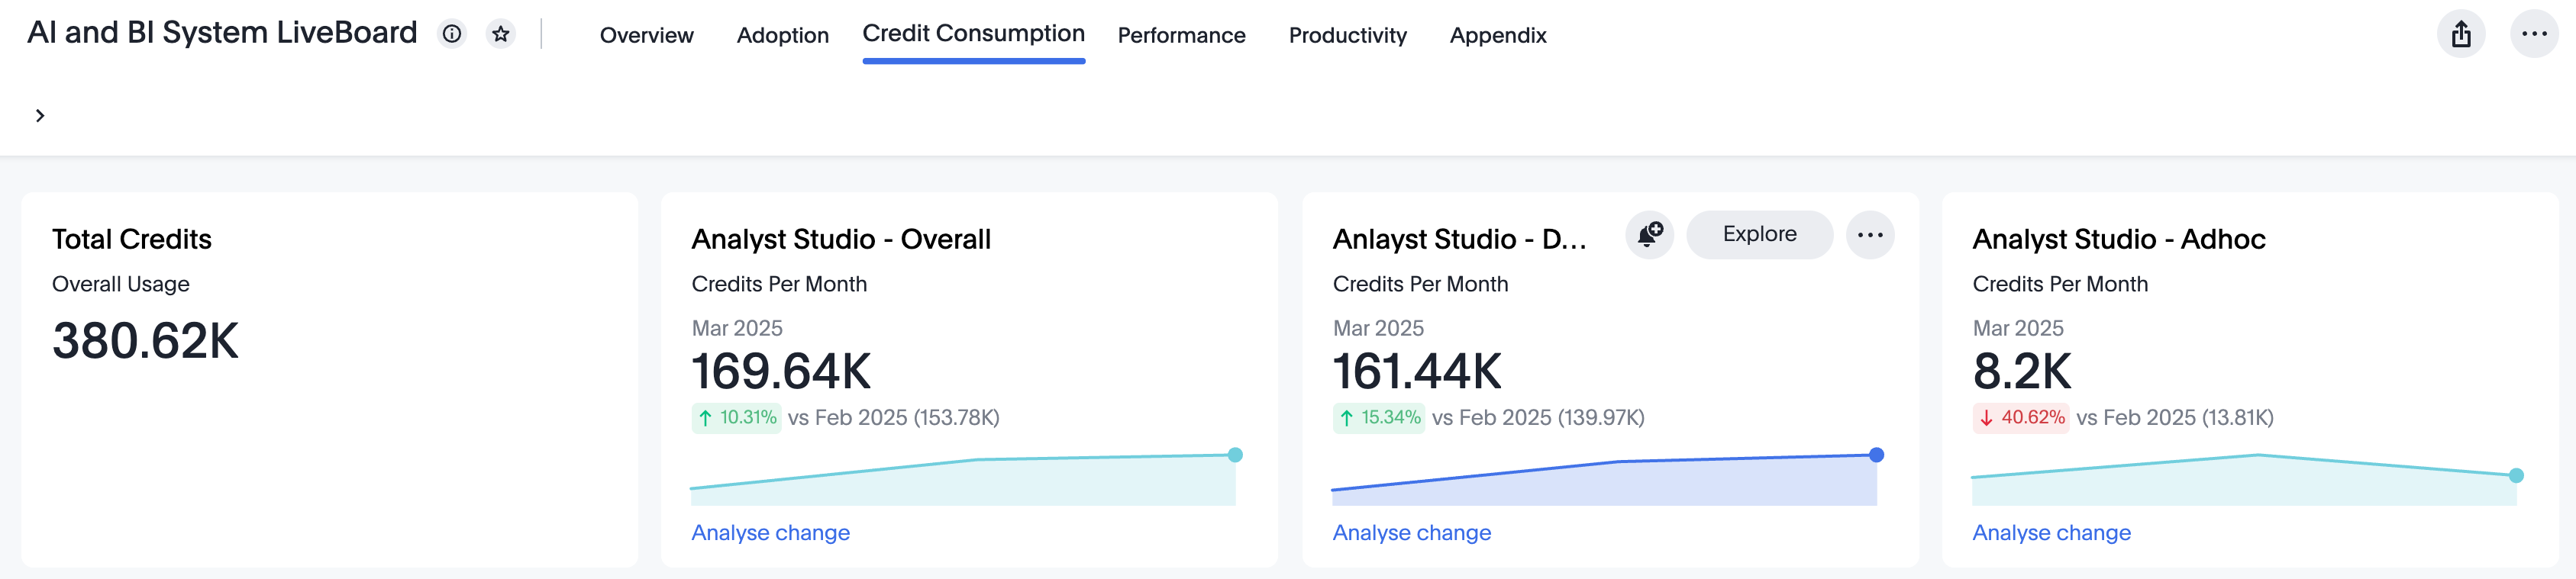
-
Cumulative number of credits consumed by all activities performed in Analyst Studio across all time periods (Total Credits)
-
Monthly credits consumed by all Analyst Studio activities (Analyst Studio - Overall)
-
Monthly credits consumed for Spotter queries (Spotter - Credit Usage)
-
Monthly credits consumed for all scheduled and manual refreshes performed in that month (Analyst Studio - Dataset Refresh)
-
Monthly credits consumed by ad-hoc queries and activities performed within Analyst Studio (Analyst Studio - Adhoc)
Groups
Analyze query activity and content engagement at the group level. Identify top-performing groups, popular data models, and per-group user action breakdowns.
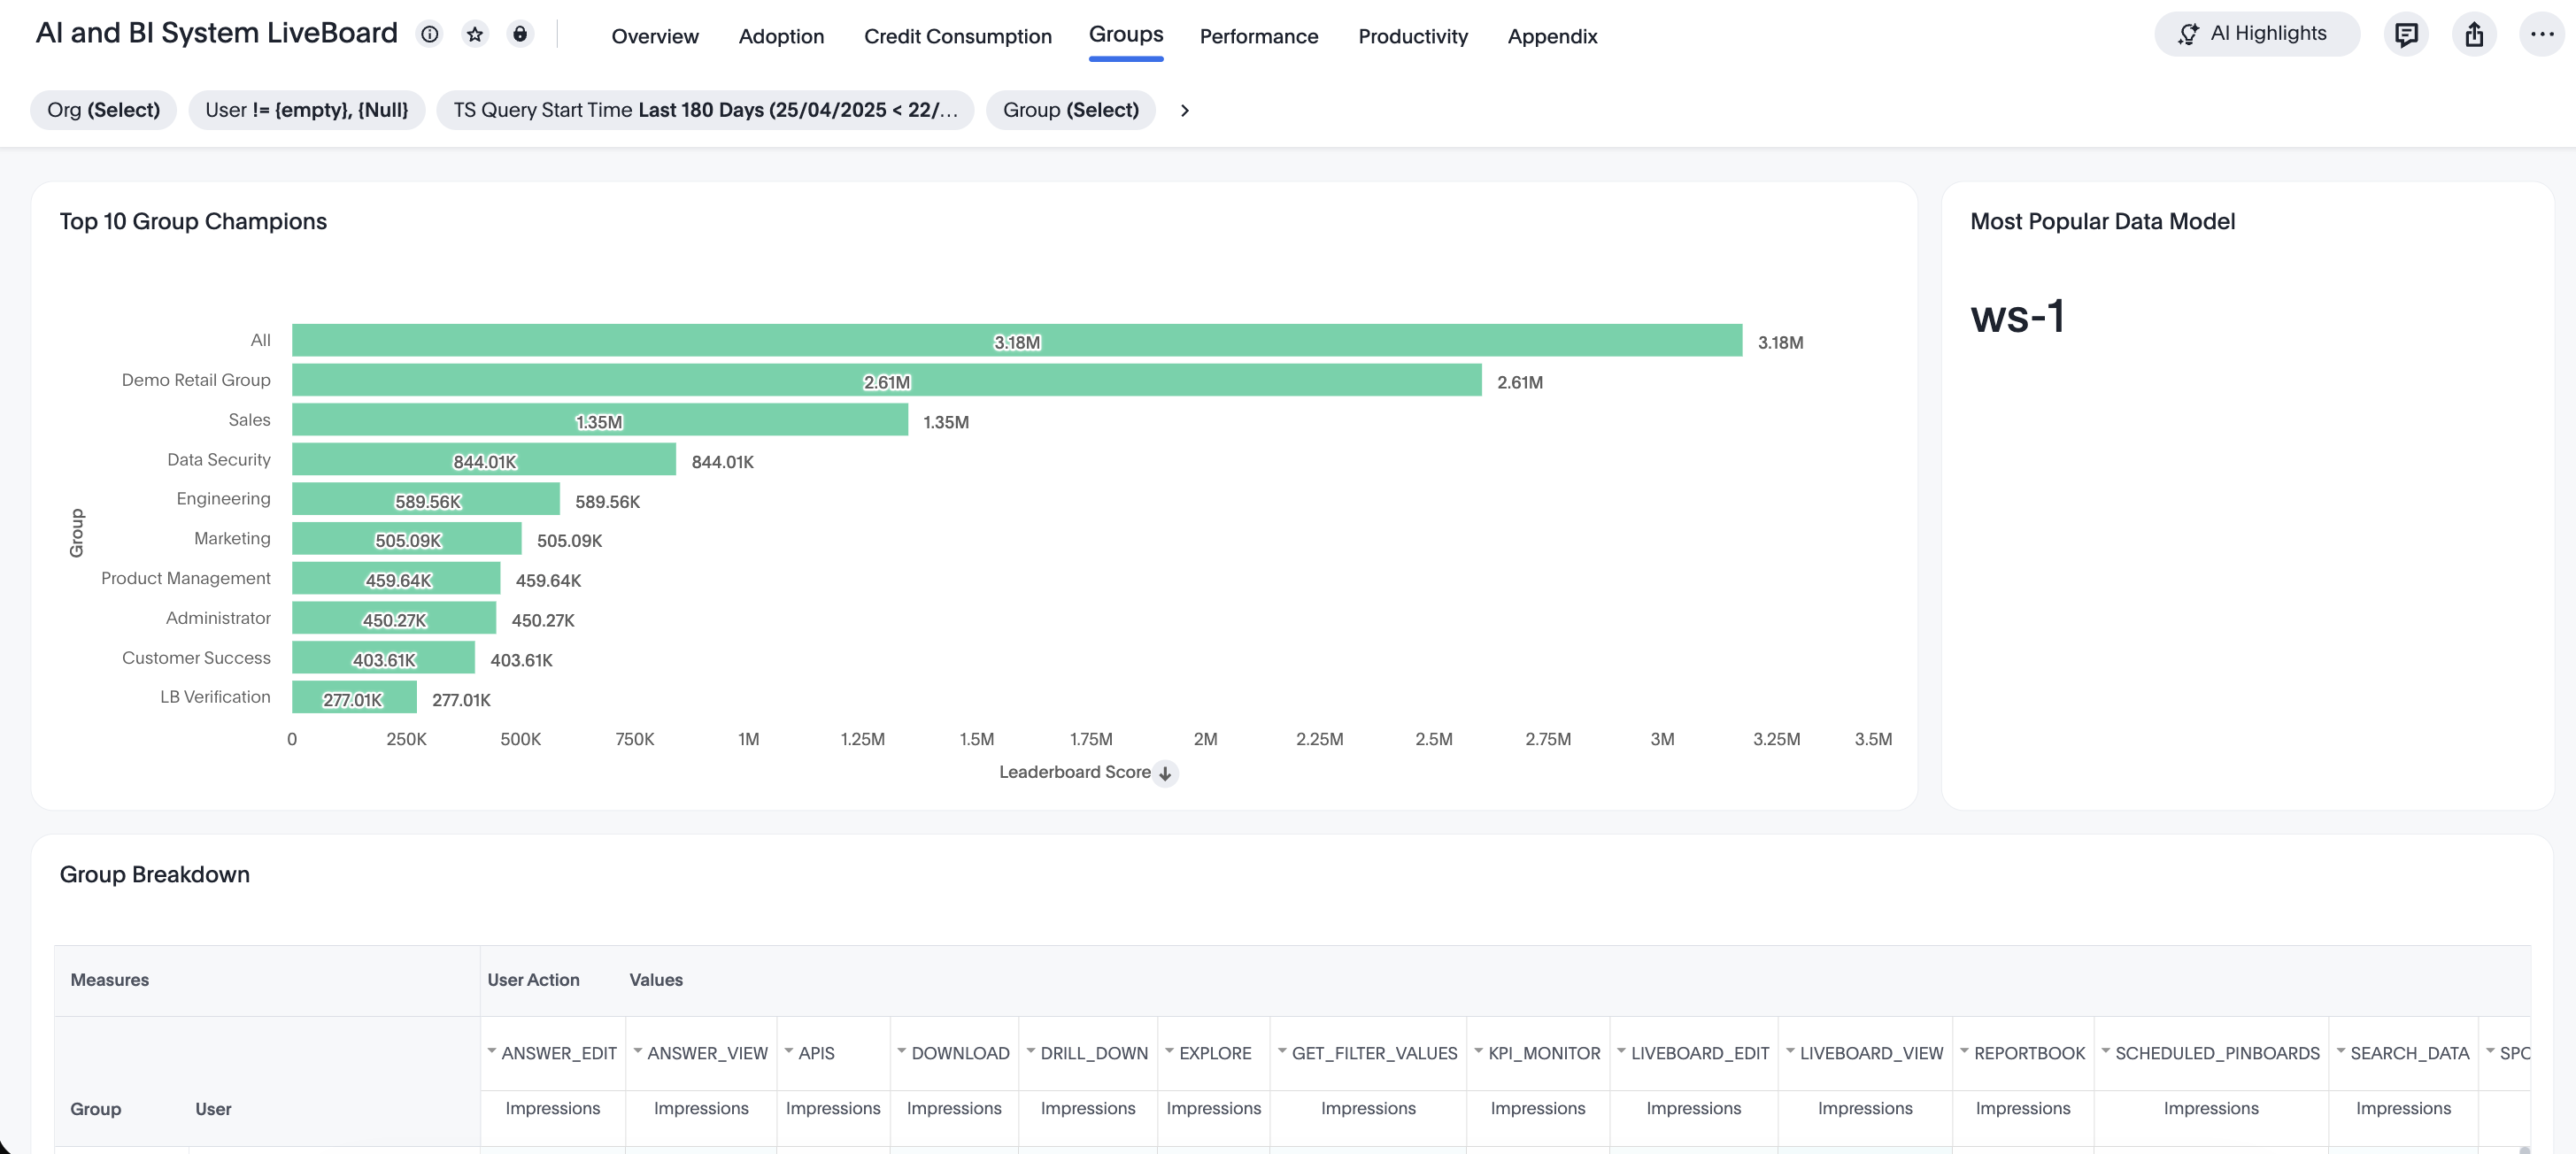
-
Leaderboard score for each group calculated using user actions at the group level and weighted scoring (Top 10 Group Champions)
-
Data model in the instance with the highest number of user action impressions (Most Popular Data Model)
-
Count of user action impressions for each group and for each user within that group (Group Breakdown)
Performance
Review query execution times and error rates to identify bottlenecks. Categorize queries by response time and drill into the 50 slowest queries.
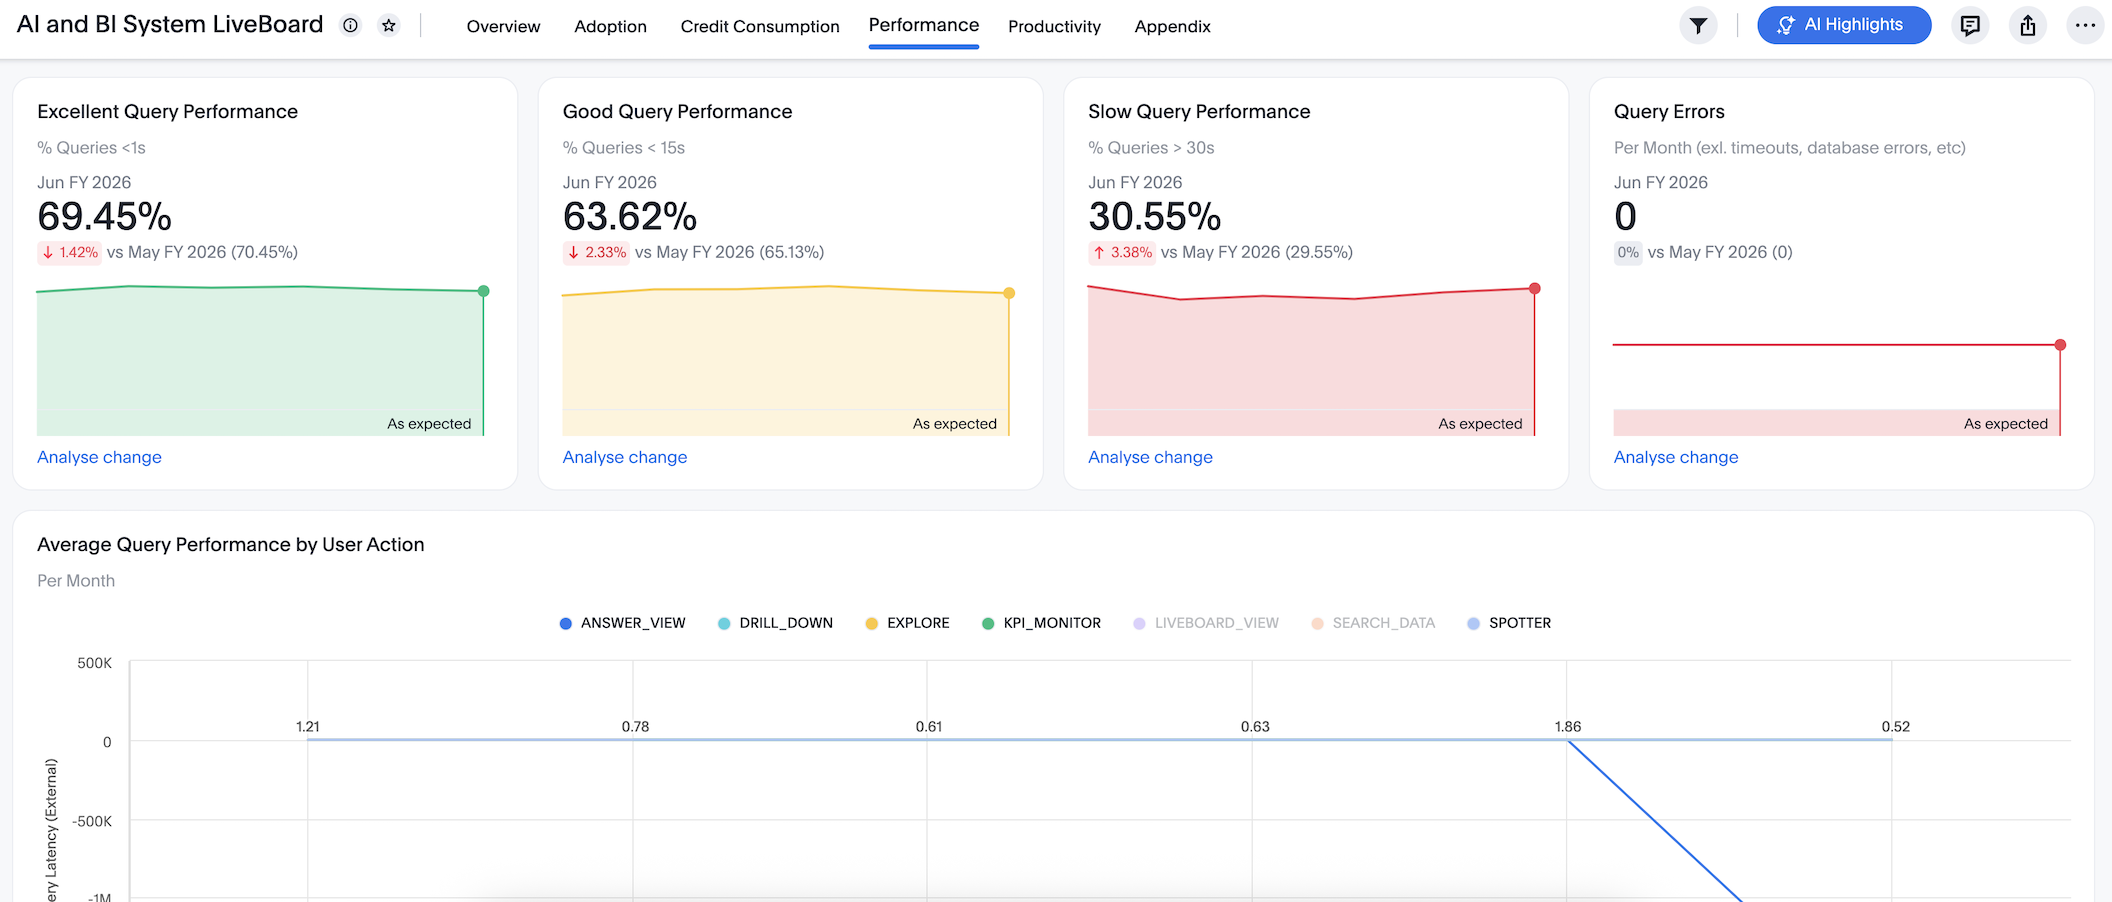
-
Queries executing in less than 1sec (Excellent Query Performance)
-
Queries executing in less than 15sec (Good Query Performance)
-
Queries taking more than 30sec to execute (Slow Query Performance)
-
Monthly query errors across the ThoughtSpot application (Query Errors)
-
Average external query latency for each user action on a monthly basis, with filters to exclude null values (Average Query Performance by User Action)
-
List of 50 slowest queries with query success status, time taken, latency experienced, and the query string (50 Slowest Search Data Queries)
Productivity
Measure time saved through features like Drill Down, Explore, Search, and Spotter. Quantify monthly productivity impact across your organization.
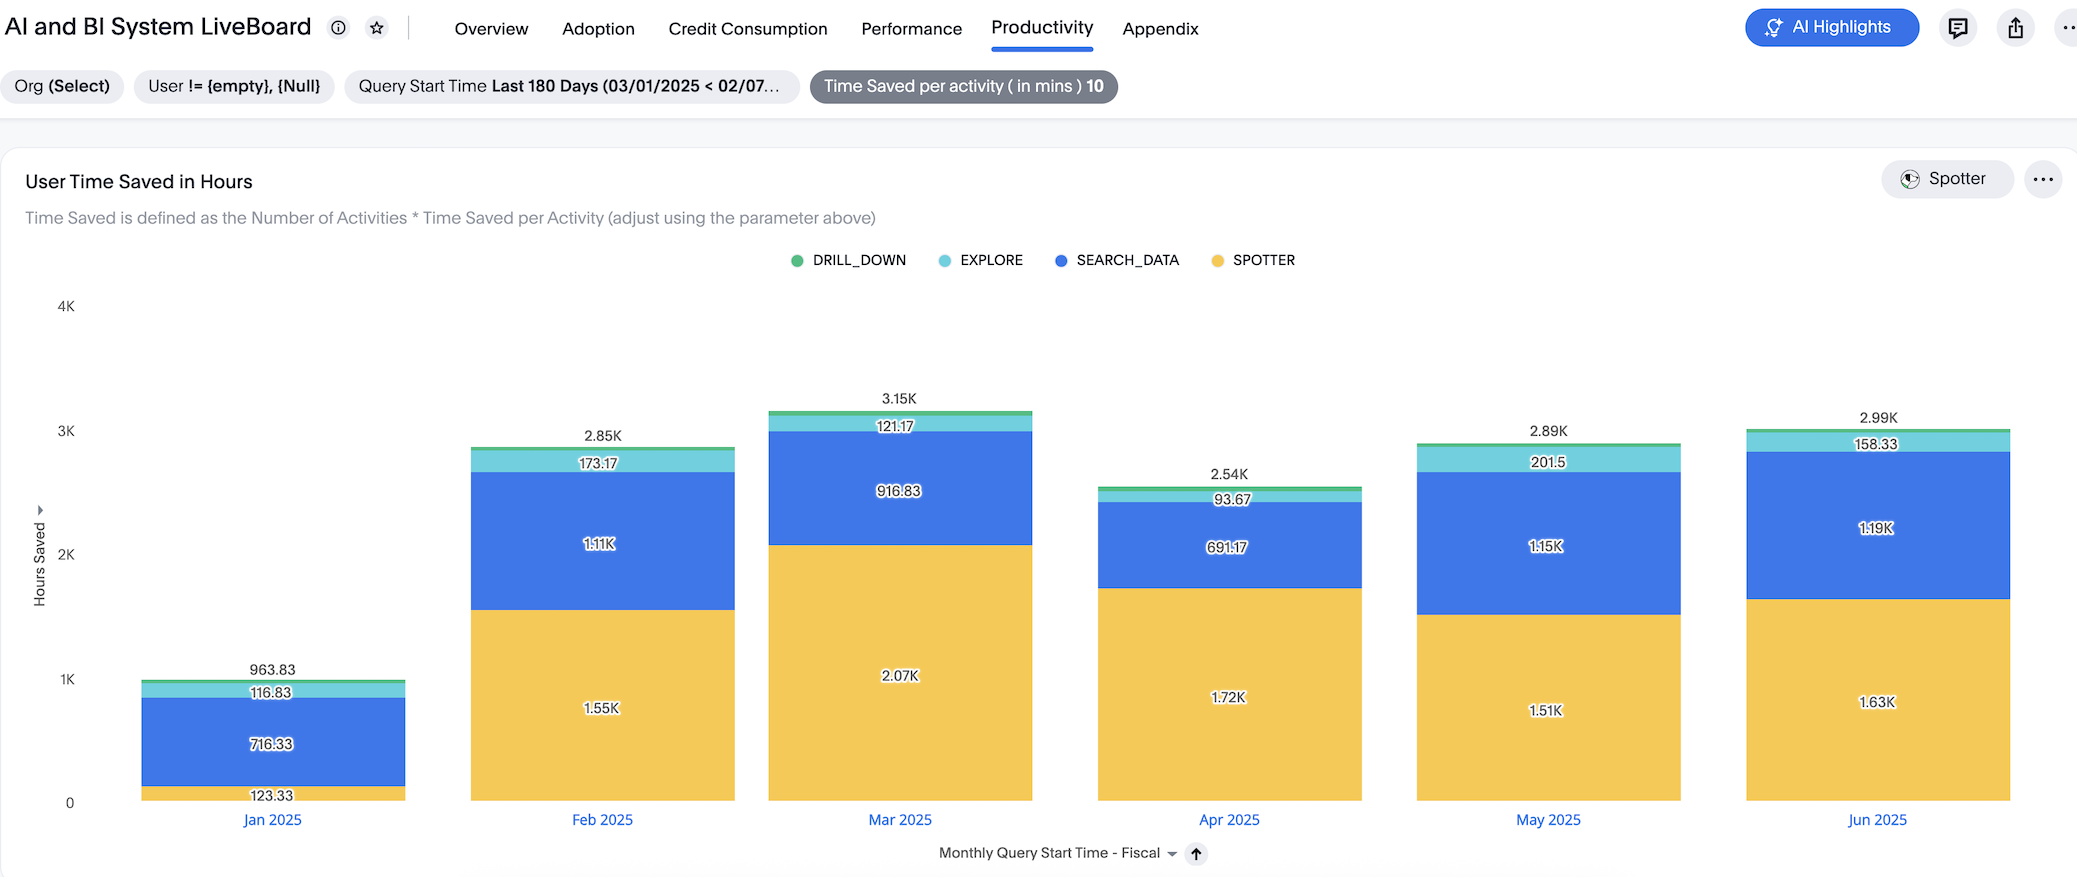
-
Monthly time saved by users across activities such as Drill Down, Explore, Search data, and Spotter.
Entitlements
Review purchased entitlements and track consumption against contracted quantities. Verify account details, pricing type, and current usage of purchased units or credits.
-
Name of the customer account (Account Name)
-
The environment type of the cluster, for example, Production or Development (Cluster Type)
-
The subscription or pricing model associated with the entitlement (Pricing Type)
-
The SKU or product code for the purchased entitlement (Product Code)
-
The ThoughtSpot product associated with the entitlement, for example, ThoughtSpot Enterprise or ThoughtSpot Embedded (Product Offering)
-
The sales opportunity identifier associated with the entitlement contract (Opportunity ID)
-
The total number of units or credits purchased under the entitlement (Quantity Purchased)
-
The total number of units or credits consumed to date (Quantity Consumed)
Appendix
View metadata about the Liveboard including query date ranges and known limitations. Understand data boundaries and verify which data sources are included.
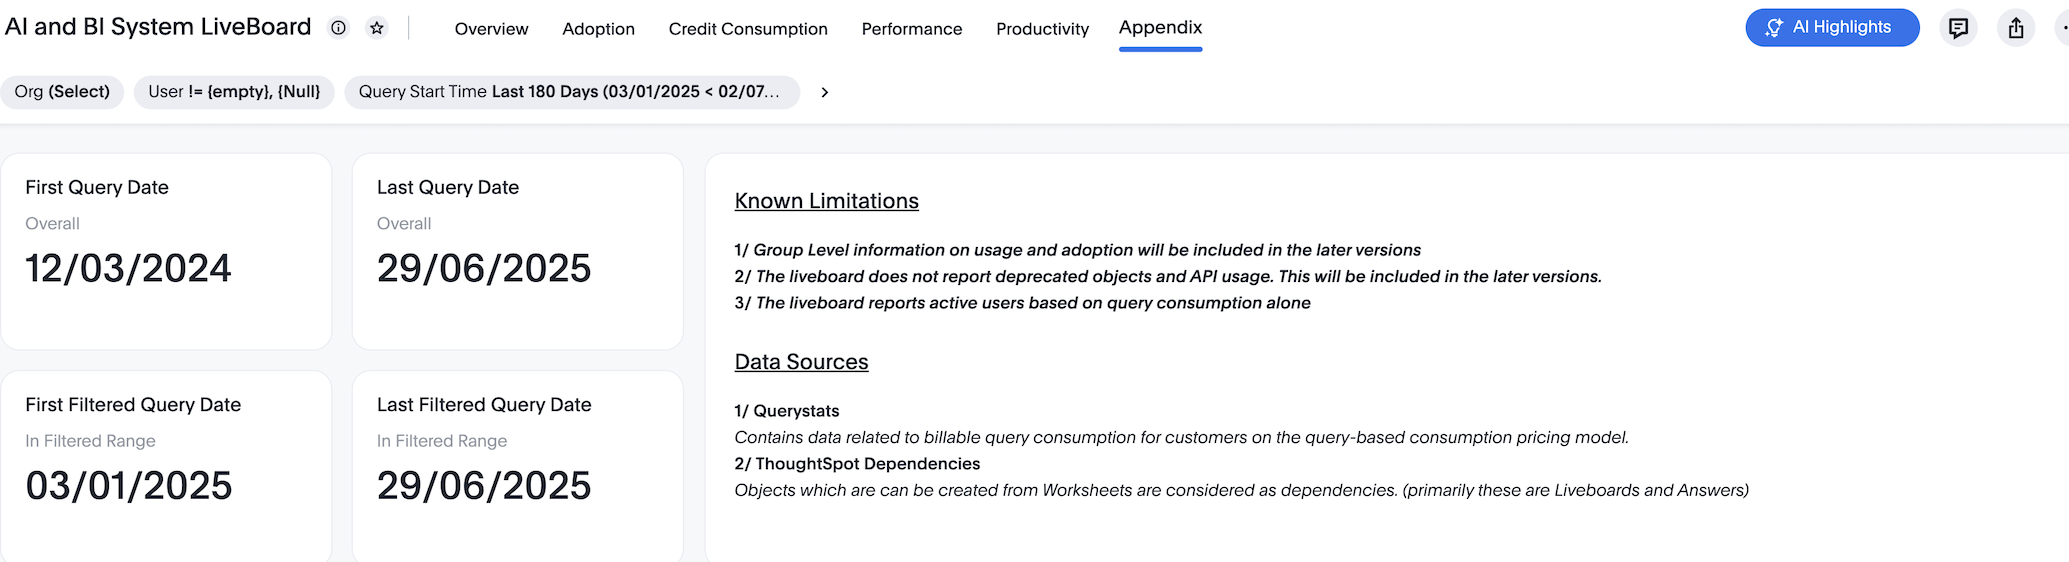
-
First interaction date with the AI and BI Stats Liveboard (First Query Date)
-
Last interaction date with the AI and BI Stats Liveboard (Last Query Date)
-
The first date when an answer with a filtered range loads or a filter is manually applied (First Filtered Query Date)
-
The last date when an answer with a filtered range loads or a filter is manually applied (Last Filtered Query Date)
-
The known limitations for the AI and BI Stats Liveboard (Known Limitations)
-
The list of data sources evaluated to populate the results on the AI and BI Stats Liveboard (Data Sources)
Best practices
The AI and BI Stats Liveboard contains valuable information you can use to monitor and manage query consumption by the users. Follow these best practices when interacting with this Liveboard:
-
Share the AI and BI Stats Liveboard with other ThoughtSpot champions and executive buyers in your organization. To share the Liveboard, you must search for the Liveboard from the Liveboards page or from the Home page. You can’t share it from the Admin Console.
-
Consider creating a dedicated group for your data leaders or champions, so you can easily share insights, such as this Liveboard, that help your teams drive adoption.
-
-
Spot query consumption trends, such as the number and types of objects accessed over time
-
Understand Spotter usage and adoption
-
Improve latency time for users across the ThoughtSPot application by analysing the slow performing queries and other health markers
Troubleshooting
Model name appears as NULL in query stats
Symptom: The AI and BI Stats system model shows NULL for model names in query stats, and no model details are displayed.
Cause: This can occur in the following cases:
-
A Liveboard or answer has been shared with a user who does not have access to the underlying model. In this case, model name fields are empty by design.
-
The answer was edited in a way that changed the query object from a model to a table. This is expected behavior.
-
The system cannot resolve the model reference from the query specification. This is a known issue addressed in release 26.7.0.cl.
Resolution:
-
Verify that the user viewing the Liveboard has access to the underlying TS: AI and BI stats model.
-
If model names are missing for a specific answer, check whether the answer references a model or a raw table.
-
If the issue persists after confirming access, this may indicate the known resolution issue fixed in 26.7.0.cl (patch available in 26.6.0.cl-66). Contact ThoughtSpot Support if you are on an affected release.
Sharing System User Liveboards with non-admin users
Symptom: A non-admin user sees a Request Access message when trying to open a Liveboard authored by a System User (for example, AI and BI Stats or Spotter Conversation), even after the Liveboard has been shared with them.
Cause: From release 26.5.0.cl, sharing a System User-authored Liveboard also requires explicitly sharing the underlying data model. Sharing the Liveboard alone is not sufficient.
Resolution:
-
Navigate to Data and locate the TS: AI and BI stats model (or the relevant system model).
-
Share the model directly with the user or group who needs access.
-
Ask the user to refresh their browser and try opening the Liveboard again.
Liveboard takes 2–3 minutes to load
Symptom: The AI and BI Stats Liveboard takes 2 to 3 minutes to fully load visualizations. SQL execution times in excess of 60,000 ms may be visible in system logs.
Cause: The TS: AI and BI stats model queries your cloud data warehouse (CDW) for query stats data. On large clusters with significant query history, CDW-side query execution can be slow, particularly on Snowflake.
Resolution:
-
Filter the Liveboard by a shorter date range to reduce the volume of data queried from the CDW.
-
Work with your Snowflake or CDW administrator to review query performance for the underlying stats tables.
-
If load times exceed 5 minutes consistently, contact ThoughtSpot Support and provide the affected request IDs from your browser network capture.