New stacked area charts
The new stacked area chart is an New area chart with an attribute in the legend, which divides the area into layers. Note that you can only use an attribute to slice with color and create layers.
Stacked area charts show the relative contribution to the accumulated total of a measure over time.
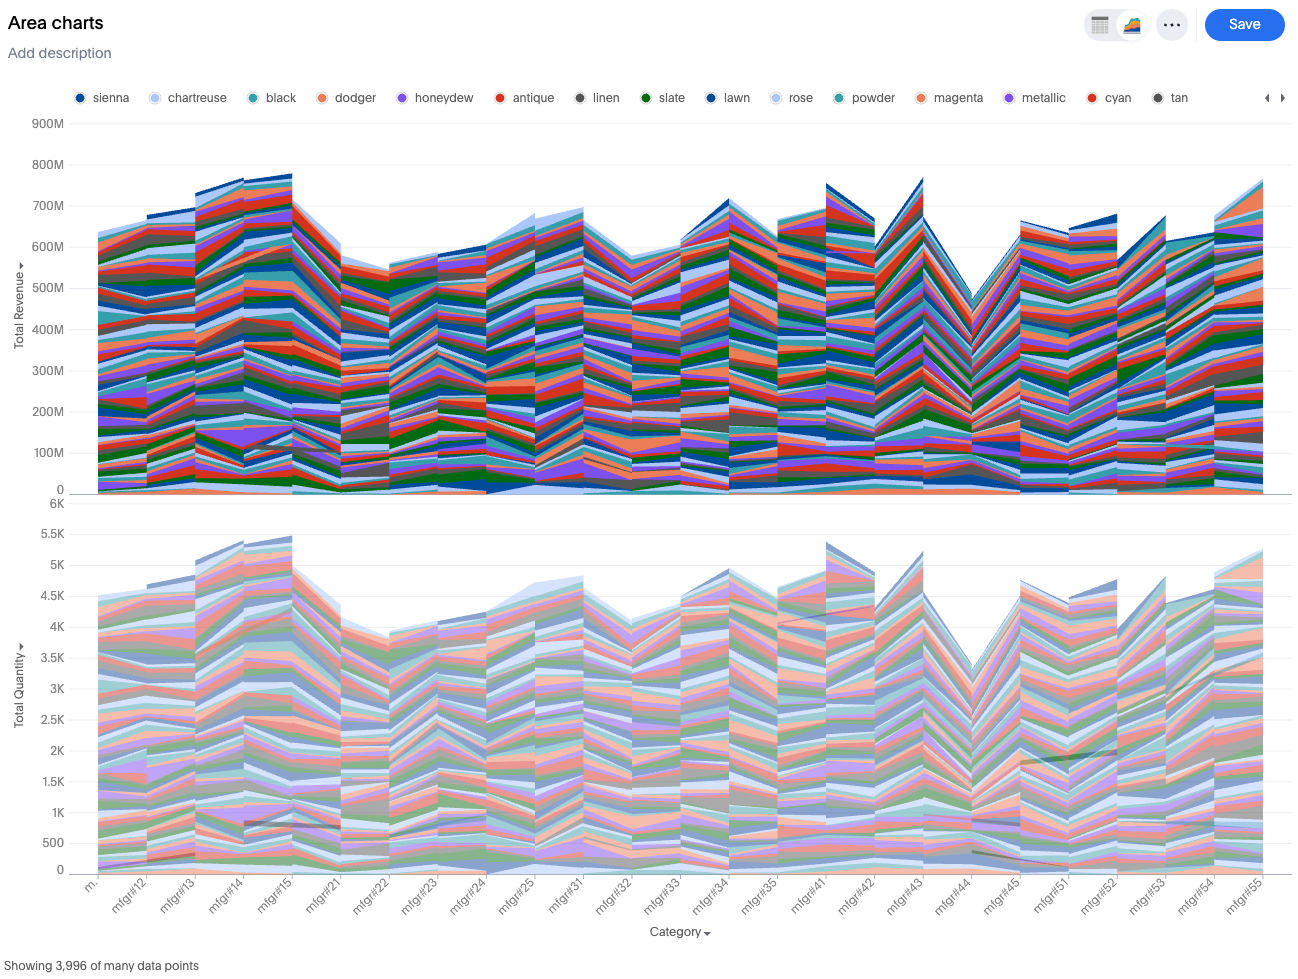
Your search needs at least two attributes and one measure to be represented as a stacked area chart.
New features
-
Single measure, slice by color present: Automatically stacks the slices of the measure and applies a stack transform.
-
Multiple measures, no slice by color: Move all measures into a shared axis (measure values construct), automatically apply stack transform on all measures.
-
Multiple measures, slice by color present: Convert to a multivariate chart where each measure is sliced by the attribute, and a stack transform is applied to each individual layer.