Spotter capabilities
For details on the new capabilities introduced in Spotter 3, see the following:
This guide showcases Spotter’s capabilities by showing examples of the various types of questions users can ask to extract actionable insights through intuitive, conversational queries.
Let’s take a look at how business users in a retail business can get insights about their day-to-day operations with the help of Spotter.
Understanding your dataset
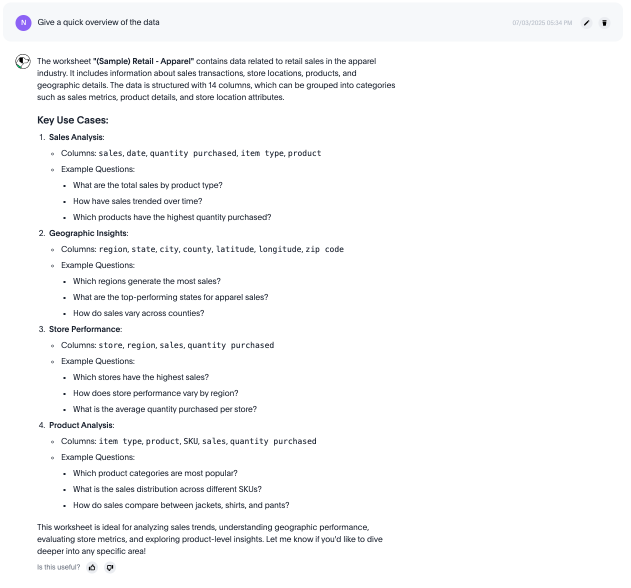
Before asking specific metric-based questions, you can ask Spotter to provide a high-level overview of the data. This helps you understand the dataset’s purpose, structure, available columns, and the key types of questions it is designed to answer.
| This capability is specific to the Spotter Agent and Spotter 3 experiences. |
| Question | Description |
|---|---|
Give me a quick overview of this dataset. What is this data about? |
Asks Spotter to describe the dataset’s purpose, structure (for example, number of columns), and key categories of information (for example, sales metrics, product details, store attributes). |
What columns can I use? |
Lists the available columns, metrics, and attributes in the data model, helping you understand what you can ask about. |
What are the key use cases for this data? |
Prompts Spotter to suggest the types of questions and analyses the dataset is designed to answer, such as sales analysis or geographic insights. |
Show me some sample questions. |
Asks Spotter to provide examples of questions you can ask, demonstrating the capabilities of the model. |
Basic questions
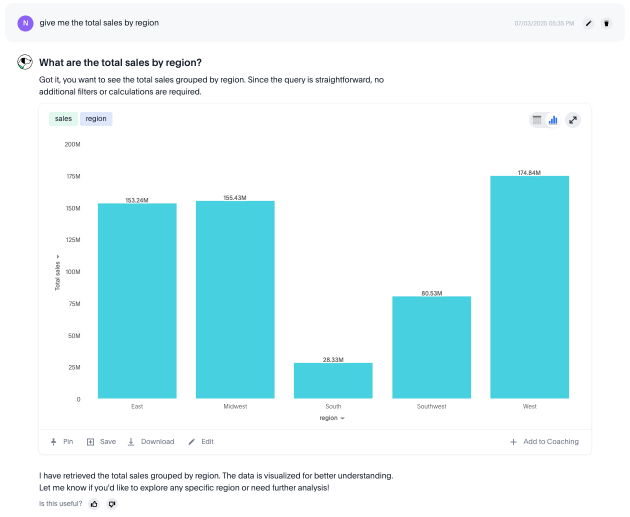
Beyond high-level summaries, you can ask more specific questions. This often involves computing summary statistics (like sum or average) grouped by specific attributes (like city or item type). You can also filter these questions using Spotter’s powerful date analysis capabilities, which include filtering for relative time periods (like 'last 10 days' or 'this year') and specific, absolute dates (like 'January' or 'today').
| Question | Description |
|---|---|
What is the average sales per city? |
Computes the average sales figure for each unique city in your data, enabling geographic performance comparison at a glance. |
Show the number of purchases by item type for this year. |
Analyzes purchase quantity across different product categories within the current year, revealing category performance. |
What was the total quantity purchased this week? |
Calculates the total quantity purchased within the current seven-day period, providing real-time insight into ongoing weekly performance. |
How many stores had purchases today? |
Identifies the count of stores with active transactions on the current day, providing real-time visibility into your retail network’s daily activity. |
Show me the total sales for Shirts item type in January of the current year. |
Isolates January sales performance for the Shirts category, enabling focused analysis on seasonal product performance. |
Show me this year’s quantity purchased for California vs Arizona. |
Provides direct state-to-state performance comparison, highlighting regional differences. |
Complex questions
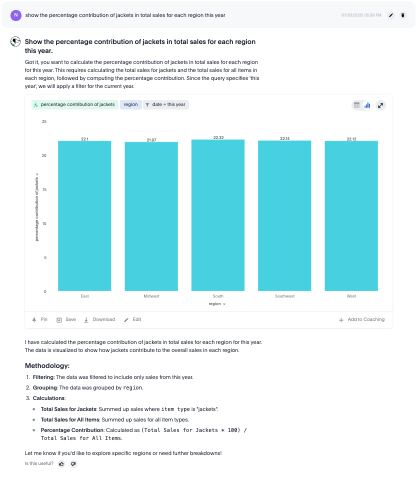
For deeper analytical insights, you can leverage Spotter’s advanced computational capabilities. This allows you to move beyond simple aggregations and ask questions that require more complex logic. For example:
-
Calculate growth (percentage change) of measures over time, such as year-over-year or month-over-month.
-
Perform arithmetic operations to derive ratios and percentages, like the percentage of total.
-
Analyze market share to measure performance relative to the total market.
-
Embed a query within another query, known as a subquery, to filter based on dynamically computed values (for example, "top 5 cities").
-
Apply conditional logic (if-then-else) to create custom categories or perform what-if analysis.
| Capability | Question | Description |
|---|---|---|
Growth |
Show the growth of sales year over year. |
Tracks annual sales growth rates over consecutive years, providing clear visibility into long-term business trajectory. |
Growth |
What is the growth of sales weekly for jackets for the last 8 weeks? |
Provides detailed week-over-week growth analysis for jacket sales across a 2-month window. |
Ratios/Percentages |
What is the percentage share of sales for each product? |
Calculates each product’s contribution to overall sales, providing a proportional view of your portfolio performance. |
Market share |
What is the market share of sales for shirts by region. |
Calculates the percentage of total sales that comes from shirts for each region. |
Subqueries |
What is the total sales of jackets only from the top 5 cities by sales? |
Performs targeted analysis by first identifying your highest-performing cities, then analyzing jacket sales within those markets. |
Subqueries |
Show products that did not have any sales in the last 3 months. |
Identifies potentially under-performing inventory by highlighting products with no recent sales activity. |
Conditional logic |
Show stores that had sales greater than $1000 yesterday and more than $500 today. |
Identifies consistently high-performing retail locations by applying multiple time-based sales thresholds. |
Conditional logic |
Show total sales by store for last month. Highlight stores as top performing… |
Calculates total sales per store, and then categorizes each store based on its sales using a conditional formula. |
Why questions with automated change analysis
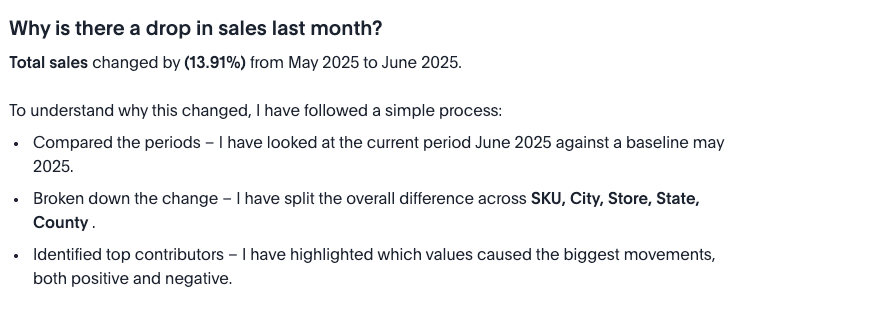
For deeper insights, you need to understand not just what happened, but why it happened. Spotter’s why capability moves you from surface-level observations to root-cause analysis within the same conversation. When you ask a direct question like, "Why did my sales drop last month?", Spotter leverages its change analysis engine to investigate the change.
It automatically performs a multidimensional analysis across relevant attributes to identify the key drivers. The results are presented with detailed visualizations and a clear, natural language summary that explains what contributed to the change, turning Spotter into a dedicated analyst.
| This capability is specific to the Spotter Agent experience. |
For more information, see Why questions in Spotter.
| Question | Description |
|---|---|
Why did my sales drop last month? |
Asks Spotter to analyze a recent time-based change (last month vs. the previous month) and identify the key drivers for the drop. |
Explain the change in website traffic last week compared to the week before. |
Prompts a direct comparison between two specific time periods to find what contributed to the difference. |
Why are churn rates higher in East than the West? |
Initiates a comparative analysis between two segments (East vs. West) to find the attributes driving the difference in the 'churn rate' metric. |
Why did sales drop in Q2? |
Analyzes a change over a larger, specific time frame (for example, Q2 vs. Q1) to identify key contributing factors. |
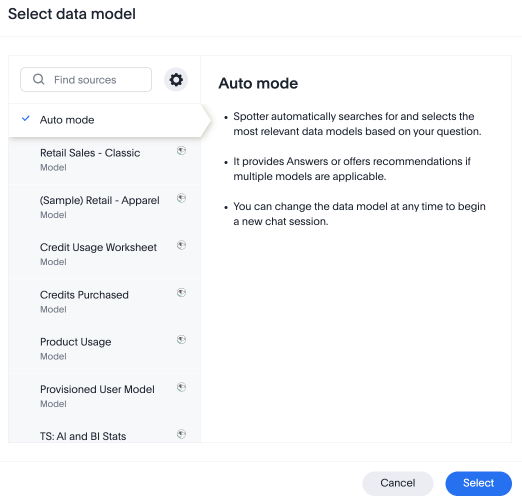
Auto mode Beta
Auto mode is a dynamic, multi-model-aware agent that identifies which data sources are needed to answer your query, searches across them, and combines the results into one synthesized response. If in doubt, Spotter asks you to validate the Model it has identified before querying.
For the first time, you can access multiple data models to answer a single query, allowing Spotter to evaluate all your data and deliver the result.
| This capability is only available in Spotter 3. |
| Question | Description |
|---|---|
What are the top open deals in the next 3 months? |
Spotter searches the data models you can access, and finds the relevant data. It accesses Liveboards and content generated by each Model to see if any seem to reference your question. If Spotter finds more than one Model that could apply to the question, it surfaces them so you can manually choose which source you meant. Spotter also displays a percentage score of its confidence in each choice and the reason it chose them to help you judge which source might be correct. |
Second question unrelated to the first question. |
Say you searched for open tickets, and then asked about sales of winter clothes. Spotter recognizes that this query is not related to your first search and begins looking for a data source that answers your question. |
Question spanning multiple data sets (For example, "Show me the accounts with high Spotter adoption and show their respective open deals in the next 6 months.") |
Spotter uses the information in your query to search for relevant data sets and evaluates them based on their data columns-- do they contain references to deals with a status as open? Do they have references to interactions with Spotter such as conversations and user queries? It finds that there is no one data set that contains all the information required, and creates an analysis plan to query multiple data sets and synthesize the answers from each data set into one answer. Spotter displays each step of its analysis so you can see what decision it makes at each point. |
For more information, see Auto mode in Spotter.
Search and Research mode
Spotter 3 supports both Search and Research modes, which are complementary coexisting modes that share the same underlying toolset but deliver different experiences. Both modes utilize the same agentic tool calls— such as executing Python code, querying the data warehouse, or searching unstructured apps like Slack– but they differ fundamentally in their reasoning and prompt complexity.
It might help to think of it like this: If Search mode is a high-speed calculator that gives you the right sum instantly, Research mode is the mathematician who shows the entire proof, explores alternative theories, and double-checks for errors before speaking.
| Question | Description |
|---|---|
How can we improve sales performance across regions? |
Spotter plans the analysis, and proposes an investigation plan, which outlines different areas it will analyze to answer the question. It surfaces the plan and asks permission to proceed. Once given the go-ahead, it performs its analysis and publishes a full report on its findings, including strategic recommendations. You can click Show work to see the steps it took to synthesize the report. |
For more information, see Search and Research modes.
Spotter Connectors Early Access
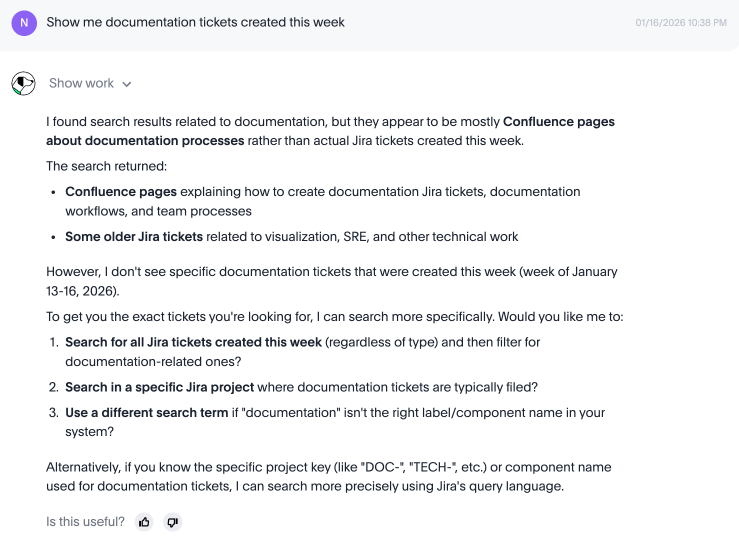
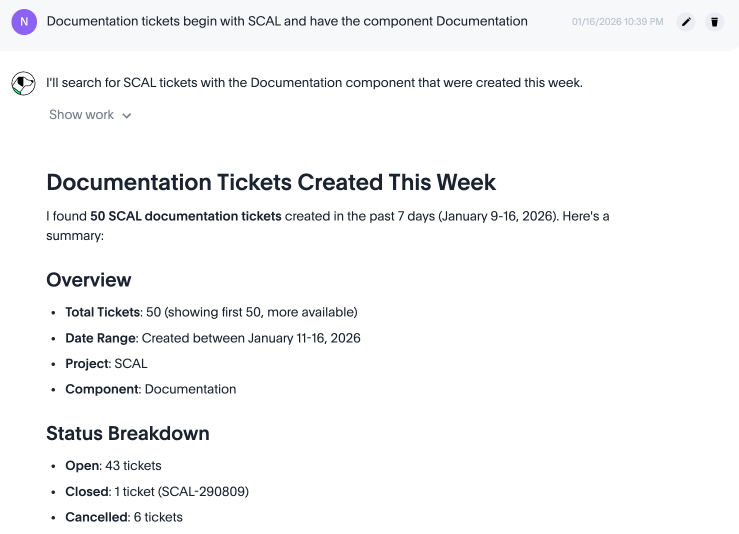
You can now integrate external tools like Slack, Jira, and Asana directly into your conversations with Spotter. ThoughtSpot acts as the primary interface. When you ask a question about a Slack thread or a Jira ticket, Spotter reaches out to those services to pull data in and search it, allowing you to search unstructured as well as structured data. Additionally, admin users can independently connect external tools that are not natively supported in ThoughtSpot.
You can also use the Connectors to send analyses to the tool itself, such as sending a direct message on Slack. This allows you to easily connect to wherever your data is stored, and send insights to team members without ever leaving Spotter.
| This capability is only available in Spotter 3. |
| Question | Description |
|---|---|
What articles do we have in Confluence for Airbnb? |
Spotter searches Confluence for relevant articles and surfaces the name and description of relevant sources. Note that you can click the name of the article to visit the page outside ThoughtSpot. |
Fetch latest updates from Sales channel in Slack. |
Spotter searches your Slack channels, identifies the one you mean, and shares the latest message. |
Use this analysis to create me a to-do list on Asana. |
Spotter takes the details of the conversation you’ve held, and sends the items on your list to Asana. |
For more information, see Integrate your tools into Spotter with Connectors.