Best practices for prompting Spotter
Spotter is a powerful tool for finding insights into your data. Like any good analyst, it performs best when you provide clear, thoughtful instructions. By learning how to frame your questions effectively, you can get to the answers you need faster and with greater accuracy. Here are five best practices to help you master your conversations with Spotter.
Best practices for Spotter 3
Spotter 3 introduces significant improvements over previous versions:
-
Autonomous analysis — Translates natural language to data queries, plans analysis, and delivers insights
-
Smarter context — Detects new questions versus follow-ups automatically
-
Clarification requests — Asks questions when uncertain instead of guessing
-
Transparent reasoning — Shows analysis steps in plain language
-
Narrative summaries — Provides insights, not just charts
Ask effective questions
Be specific about your intent
Spotter handles open-ended questions but uses its own judgment to plan analysis. Specify dimensions explicitly if needed.
| Less effective | More effective |
|---|---|
"How are sales doing?" |
"How are sales doing? I expect analysis at region and store level." |
"Show me customer data." |
"Show me customer acquisition by channel." |
"What’s our performance?" |
"Revenue performance this quarter. Compare it against last quarter and same quarter last year." |
Use Research Mode for complex analysis
-
Ask a high-level question (for example, "Analyze customer retention trends and identify risk factors").
-
Review the proposed analysis plan.
-
Add or remove steps as needed.
-
Approve the plan.
-
Receive a comprehensive report.
| Research Mode works best for quarterly reviews, root cause analysis, and multidimensional investigations. |
Use Auto mode
Use Auto mode if you don’t know which Model to use. Auto mode also supports cross-source queries in case you want to query data from multiple sources to generate insights:
"Show high-usage customers and their open support tickets."
"Which sales reps have the most deals but lowest close rate?"
| Manual data model selection improves accuracy when models have overlapping data. |
Verify and use results
Review the reasoning
-
Expand the reasoning section in the response.
-
Check how Spotter interpreted your question.
-
Verify the data sources used.
-
Review key decisions made during analysis.
Unsure about a response
-
Ask Spotter to explain its analysis.
-
Ask Spotter to verify its analysis or double-check a specific result.
Request clarification
If results seem incorrect, ask Spotter to explain:
"How did you calculate that percentage?"
"Why did you exclude those records?"
"Double-check this calculation"
Identify non-data responses
Spotter can answer open-ended questions, but ambiguous queries may produce responses from general knowledge instead of your data.
Signs of a non-data response:
-
Generic-sounding answer
-
No specific numbers from your data
-
Reasoning block shows no data queries
- To fix this
-
Be more specific, or select a data model before asking.
Feature-specific guidance
For more information on specific feature capabilities, see Spotter capabilities.
Research mode
| Always review the analysis plan before approval. Add specific dimensions or comparisons you need. |
-
Expect longer processing time for thorough analysis.
-
Remove irrelevant steps to save time and cost.
-
Don’t close the tab while running Research mode to ensure Spotter finishes its analysis.
Auto mode
| Works best when the overlap between available data models is low. |
-
For overlapping models, specify the data model name if you already know it.
-
Ask Spotter to run queries on multiple models if you cannot choose.
-
Ask Spotter to share more details about suggested data models if you need help deciding.
- For analysts
-
End users may have access to fewer Models. Results vary based on user permissions.
Connectors
-
Specify the Connector name and how to use it for better results.
-
Add external context using Connectors to bring unstructured content into Spotter.
-
Use Connectors to take actions or share insights from Spotter.
Best practices for Spotter 1 and 2
Structure your questions
The most effective way to get a precise answer is to structure your questions with three key components in mind. Think of it as providing a clear brief to your analyst. A good rule of thumb is to specify the “what”, the “how”, and the “where” you are looking for in your answer.
- What calculation do you need?
-
Specify the metric or computation you want to see.
- Examples
-
Total sales, year-over-year growth
- How should the results be grouped?
-
Define the dimensions or categories you want to break the data down by.
- Examples
-
by region, per store
- Where should Spotter look?
-
Apply filters to narrow down the data to the specific subset you’re interested in.
- Examples
-
for last week, for the East region
A good question clearly defines the calculation, grouping, and filters. Here’s how that looks in practice:
| Vague question | Structured question |
|---|---|
"How are my reps doing?" |
"What is the total sales revenue (What) for each sales representative (How) in the Northeast region for Q2 (Where)?" |
"Did our last campaign work?" |
"Show me the customer acquisition cost (What) by marketing channel (How) for the 'Holiday 2024' campaign (Where)." |
"Which products should I reorder?" |
"List the products with less than 30 days of stock remaining (What), broken down by warehouse location (How), based on the last 90 days' sales velocity (Where)." |
"Are we closing tickets fast enough?" |
"What was the average time to resolution in hours (What) for each support agent (How) on 'High Priority' tickets created last month (Where)?" |
"How profitable are our product lines?" |
"Compare the net profit margin (What) across all product categories (How) for the last fiscal year (Where)." |
Iterate
You don’t need to ask the perfect, complex question on your first try. Spotter is designed for a conversational flow. Start with a broader question and refine it based on the results.
For example, you might start with a broad question: “What are the sales of the top 5 products by category?” Spotter shows the overall top 5 products and their categories.
Then you can refine your grouping: “I wanted the top 5 products in each category.” Spotter corrects the analysis to show a per-category ranking.
Try adding a filter: “Show data for last week.” The analysis is now filtered to the most recent time period.
Ask a follow-up calculation: “What was the percentage contribution of bags in the total sales last week?” Spotter performs a new calculation based on the context of the conversation.
Be specific
AI models are powerful, but they shouldn’t be left to guess your intent. Ambiguity is the primary cause of unexpected or inconsistent answers.
Be careful how you phrase your question, to avoid multiple possible interpretations. For example, if you ask “What are the total sales for the Southern region?”, do you mean only the South region, or should the Southwest region be included?
One option is to coach Spotter’s business terms to clarify that South should include the Southwest region. However, if this interpretation is not universally applicable to your business, it is better to be explicit in your questions rather than trying to add coaching to Spotter. You can ask, “What are the total sales for the Southern region, excluding Southwest?” or “What are the total sales for the Southern region, including Southwest?”
You should also be clear about the criteria when asking for rankings. If you ask “What are my most selling products?”, how should Spotter interpret “most selling”? Does it mean highest revenue, greatest quantity sold, or highest profit margin? Instead, ask “What are the top 5 products by revenue for last year?” or “Show me the products with the highest quantity sold last month in the East region.”
Provide details on time frames and calculations
To get the right answer quickly and efficiently, always be explicit about time frames and complex calculations.
If you don’t provide a time frame, Spotter will query your entire data history. This can be slow, costly, and rarely provides the insight you actually need. Instead of asking “What are the total sales for the Southern region?”, ask “What are the total sales for the Southern region in Q3?”
If you need a calculation like “percentage contribution,” briefly explain the logic. This ensures Spotter builds the formula exactly as you intend. Instead of asking “What is the percentage contribution of the East region for the last three months?”, say “For the last three months, show me the East region’s sales as a percentage of total sales, and break the results down monthly.”
Teach Spotter your business language
If you find yourself repeatedly clarifying the same business term (like the Southern region example above), teach Spotter what you mean.
You can click + Add to coaching below an Answer to create custom definitions. If you define the business term “Southern region” as region= ‘South’ OR region = ‘Southwest’, Spotter will use that interpretation in all your questions including that term, saving you time and ensuring consistent analysis across your team.
For more information on coaching, reference Reference questions and Defining business terms.
How to validate the results generated by Spotter
In order to help you understand how Spotter works, we provide a simplified syntax that allows you to validate the output generated by Spotter without learning the SQL syntax.
You can verify Spotter’s results by checking the query and by comparing it to the previous step in the conversation.
Verify the query
Every answer generated by Spotter also shows the query in a simplified syntax. The simplified representation presents only the most meaningful information that you can validate easily.
Let’s take an example of the query. Say you asked a question: “What are the monthly sales for jackets in the southern region this year?”
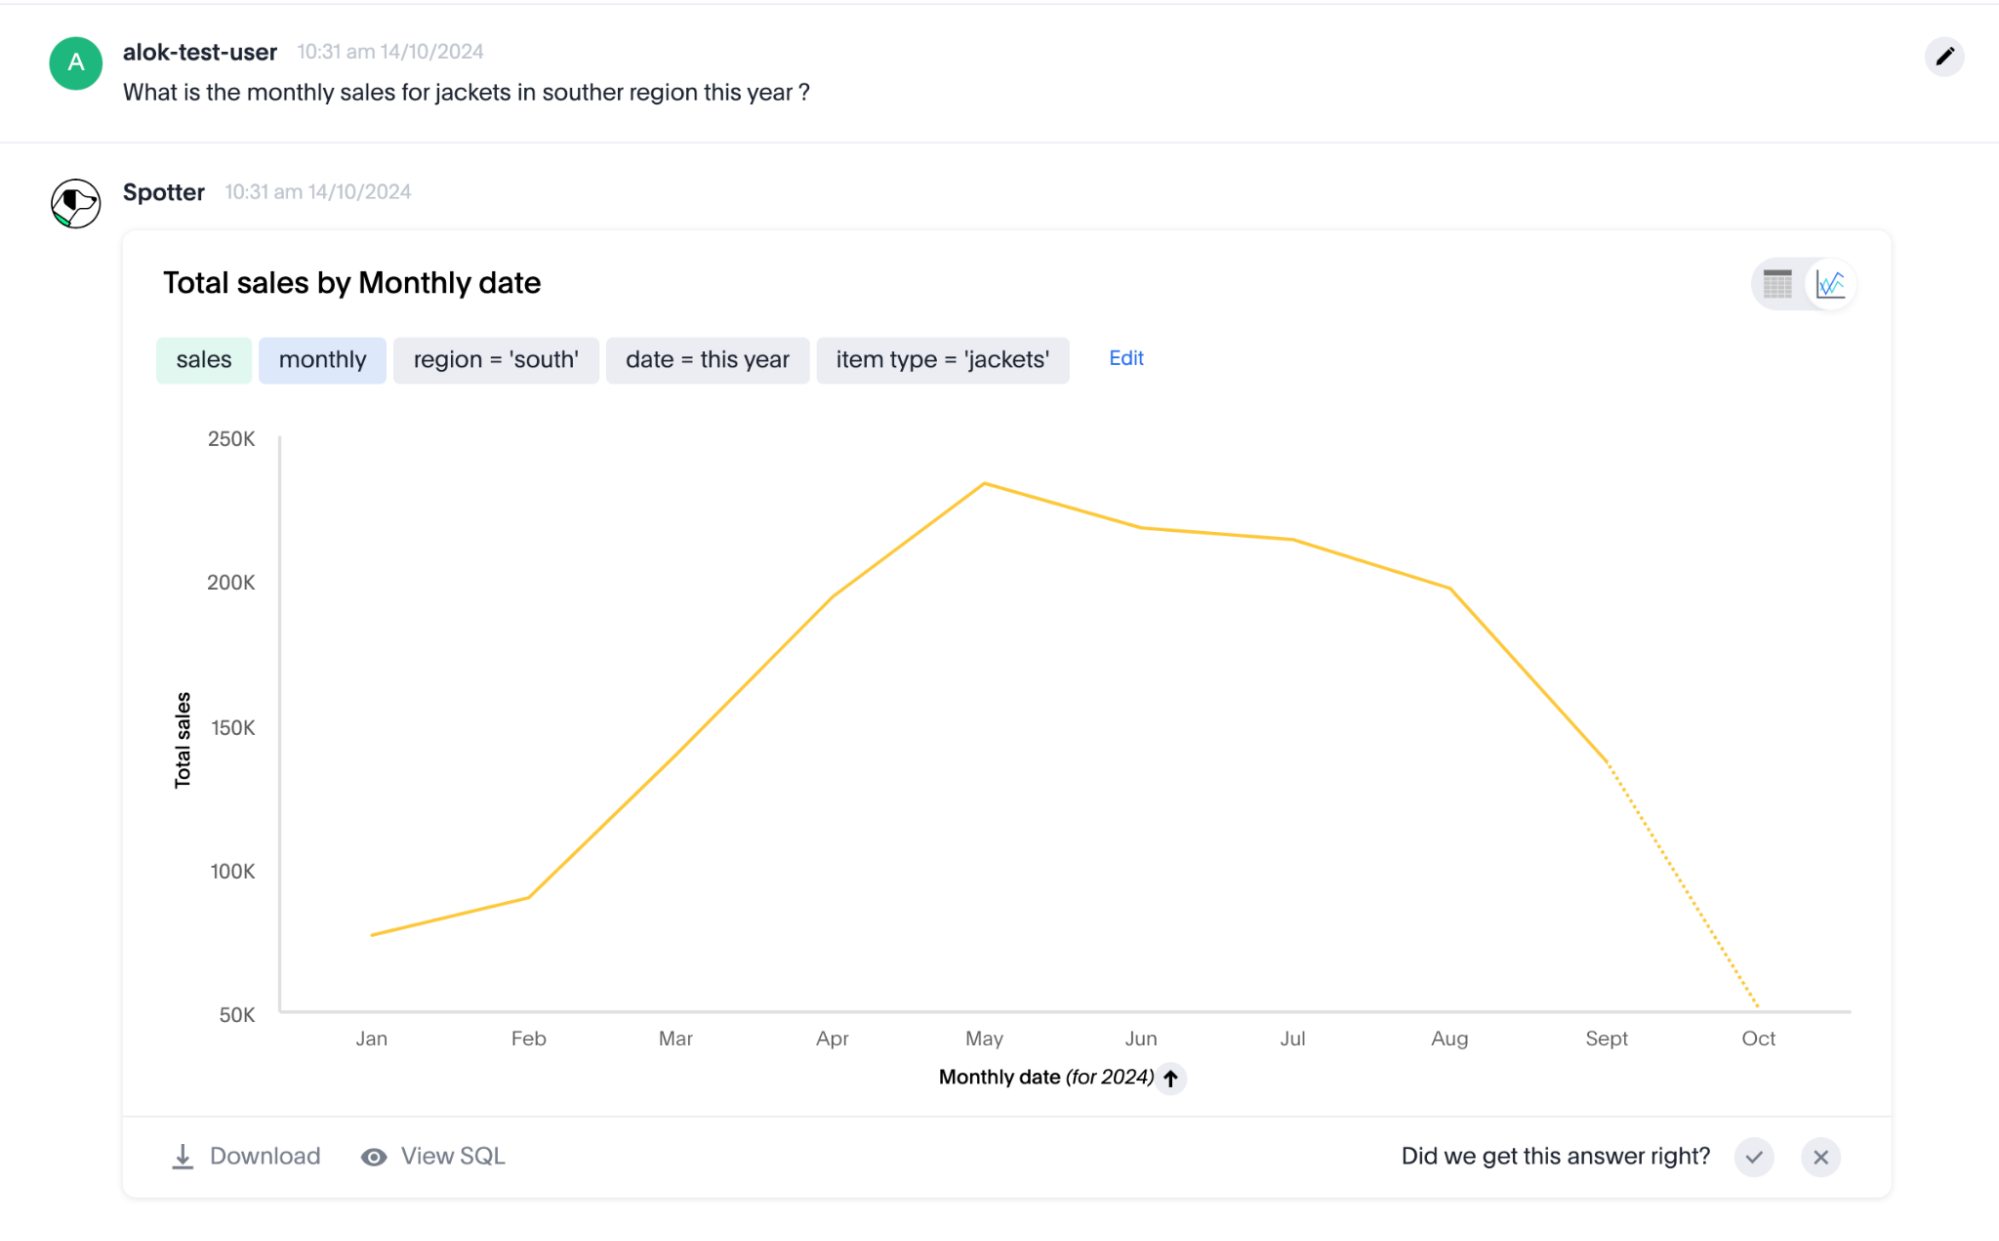
The answer shows the query. A quick look at this query shows that the system has performed the following actions:
- Mathematical computation
-
The mathematical computations are highlighted in green in the query syntax. In the example above, we can see that the
salescolumn is marked in green, which shows that we have computed the total sales. - Groupings
-
The groupings are highlighted in blue in the search query. In the above example, we can see that
monthlygrouping is being used. The axis label also shows that thedatecolumn is used for this monthly grouping. - Filters
-
The filters are represented in gray. The query also shows that the system has applied a filter on
item type=’jackets’,date=’this year’, andregion=’south’.
Glancing at the above query quickly reveals that the system has done most of the things we asked for. However, it has not considered the southwest region as part of the southern region. We recommend that you always check the search data query, as it provides an easy way to validate all the important choices of the column values picked by the system and how it is using them to build the answer.
Validate the change from the previous step in the conversation
Spotter considers each new input in the conversation as a follow-up to the previous message. As your answer becomes more and more complex in the conversation or when you start the Spotter experience from a Liveboard, you don’t have to continuously validate the query for each answer generated by the system.
In the case of follow-up questions, we provide a quick summary before the answer which showcases what has changed from the previous step. For example, if we ask Spotter to “Show this for the last 3 months only” for the question asked in the previous step. Spotter shows that a new date filter, ‘date = last 3 months’, is added, and the previous date filter, ‘date=this year’, is removed. This helps you validate the changes made by Spotter at each step, simplifying the verification process for simple follow-ups.