Change chart mark style
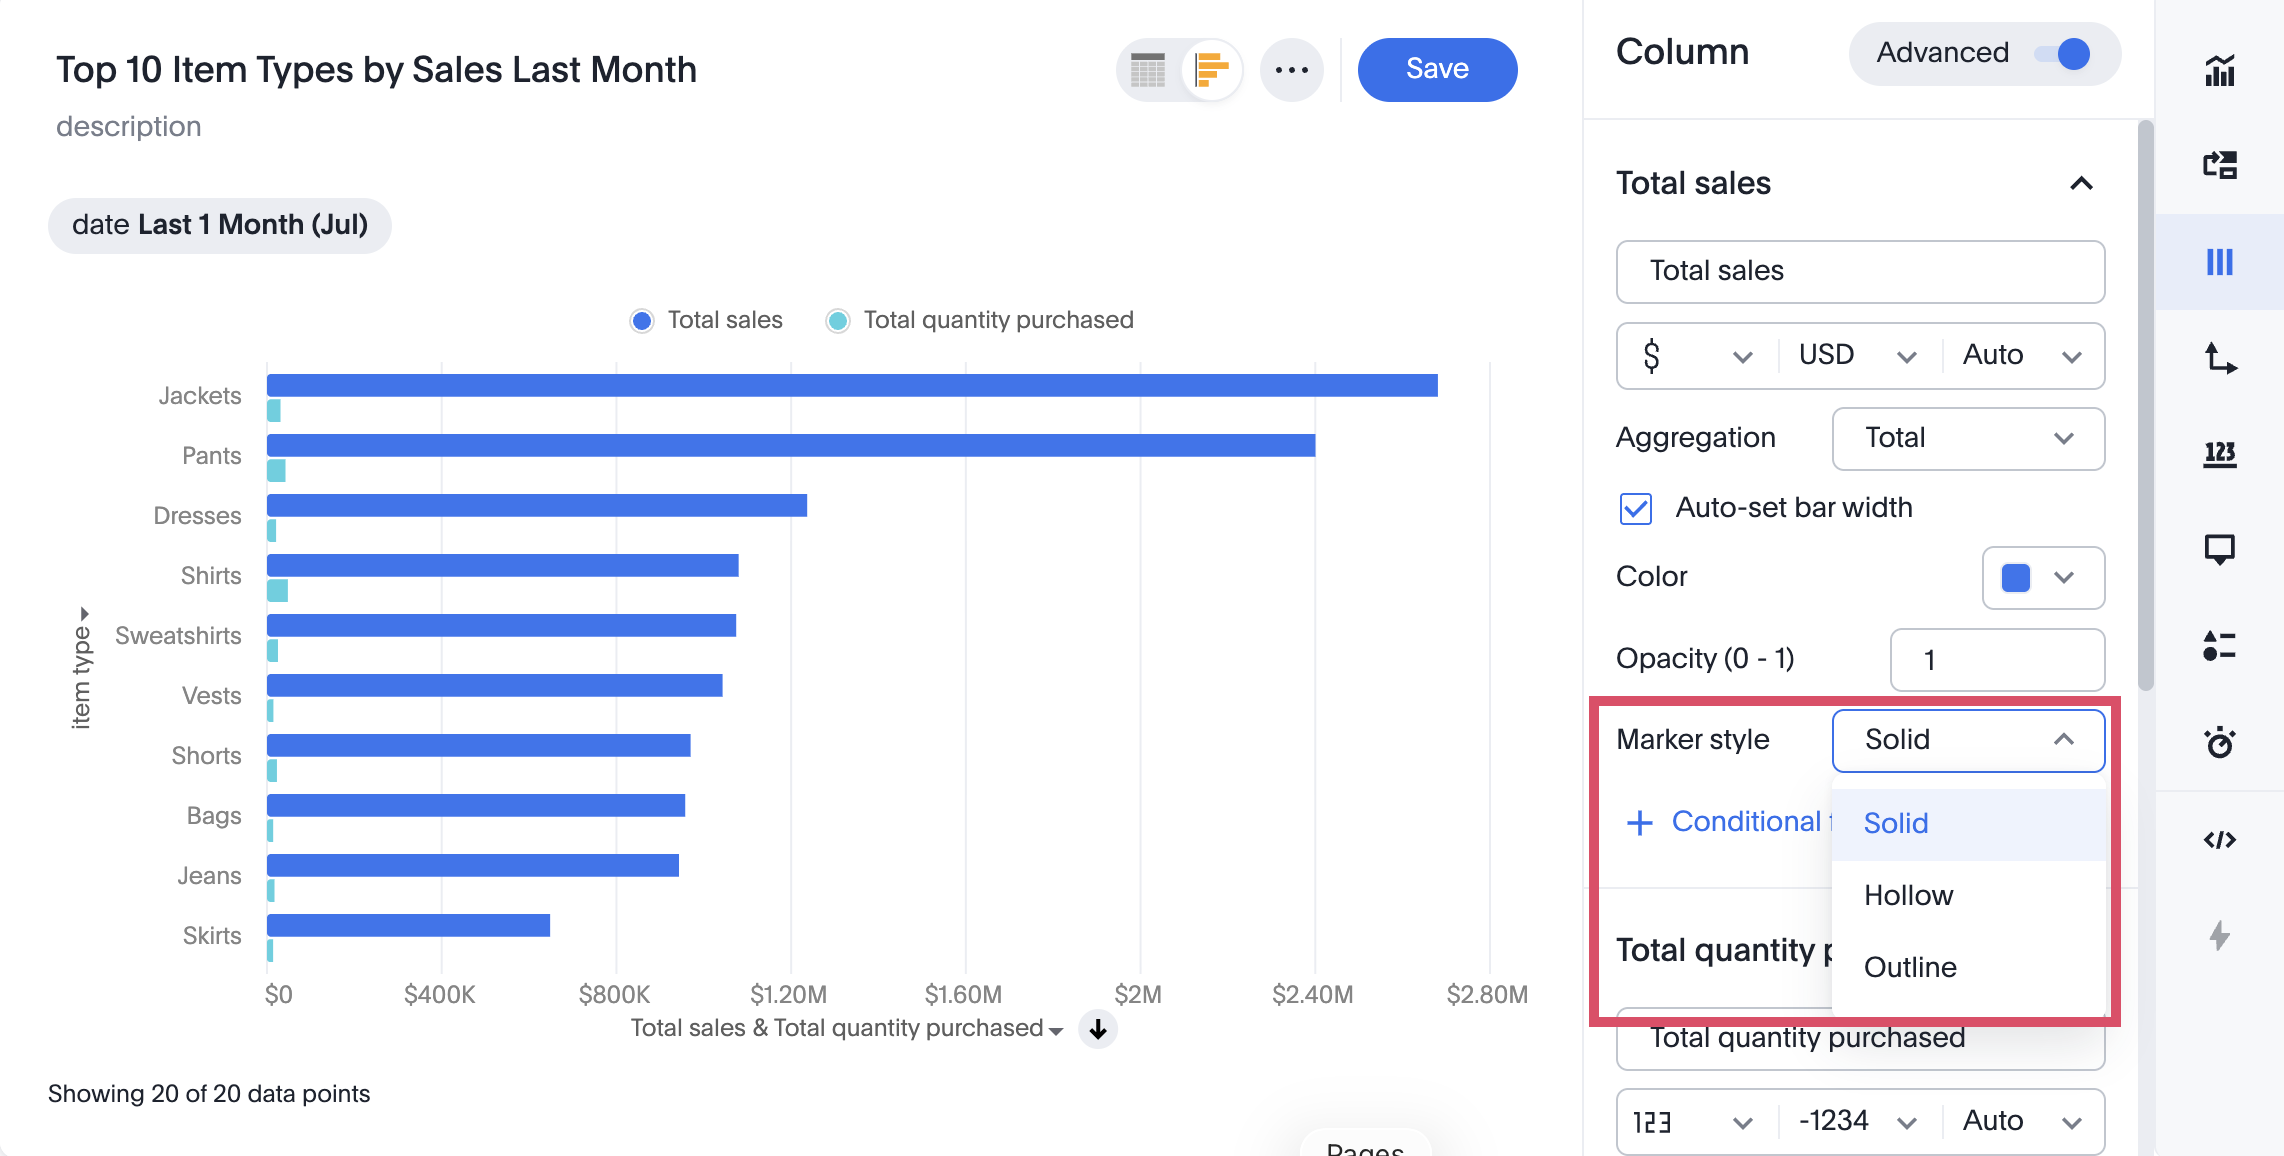
You can control how chart marks (bars, points, and arcs) appear by setting their mark style to Solid, Hollow, or Outline. This lets you distinguish data series visually through different outlines rather than color alone.
|
Mark style settings apply to bar, point (scatter/bubble), and arc (donut) charts. Mark style is not available for line or area charts. |
Mark style modes
| Mode | Description |
|---|---|
Solid (default) |
The mark renders as a solid fill. No outline is applied. |
Hollow |
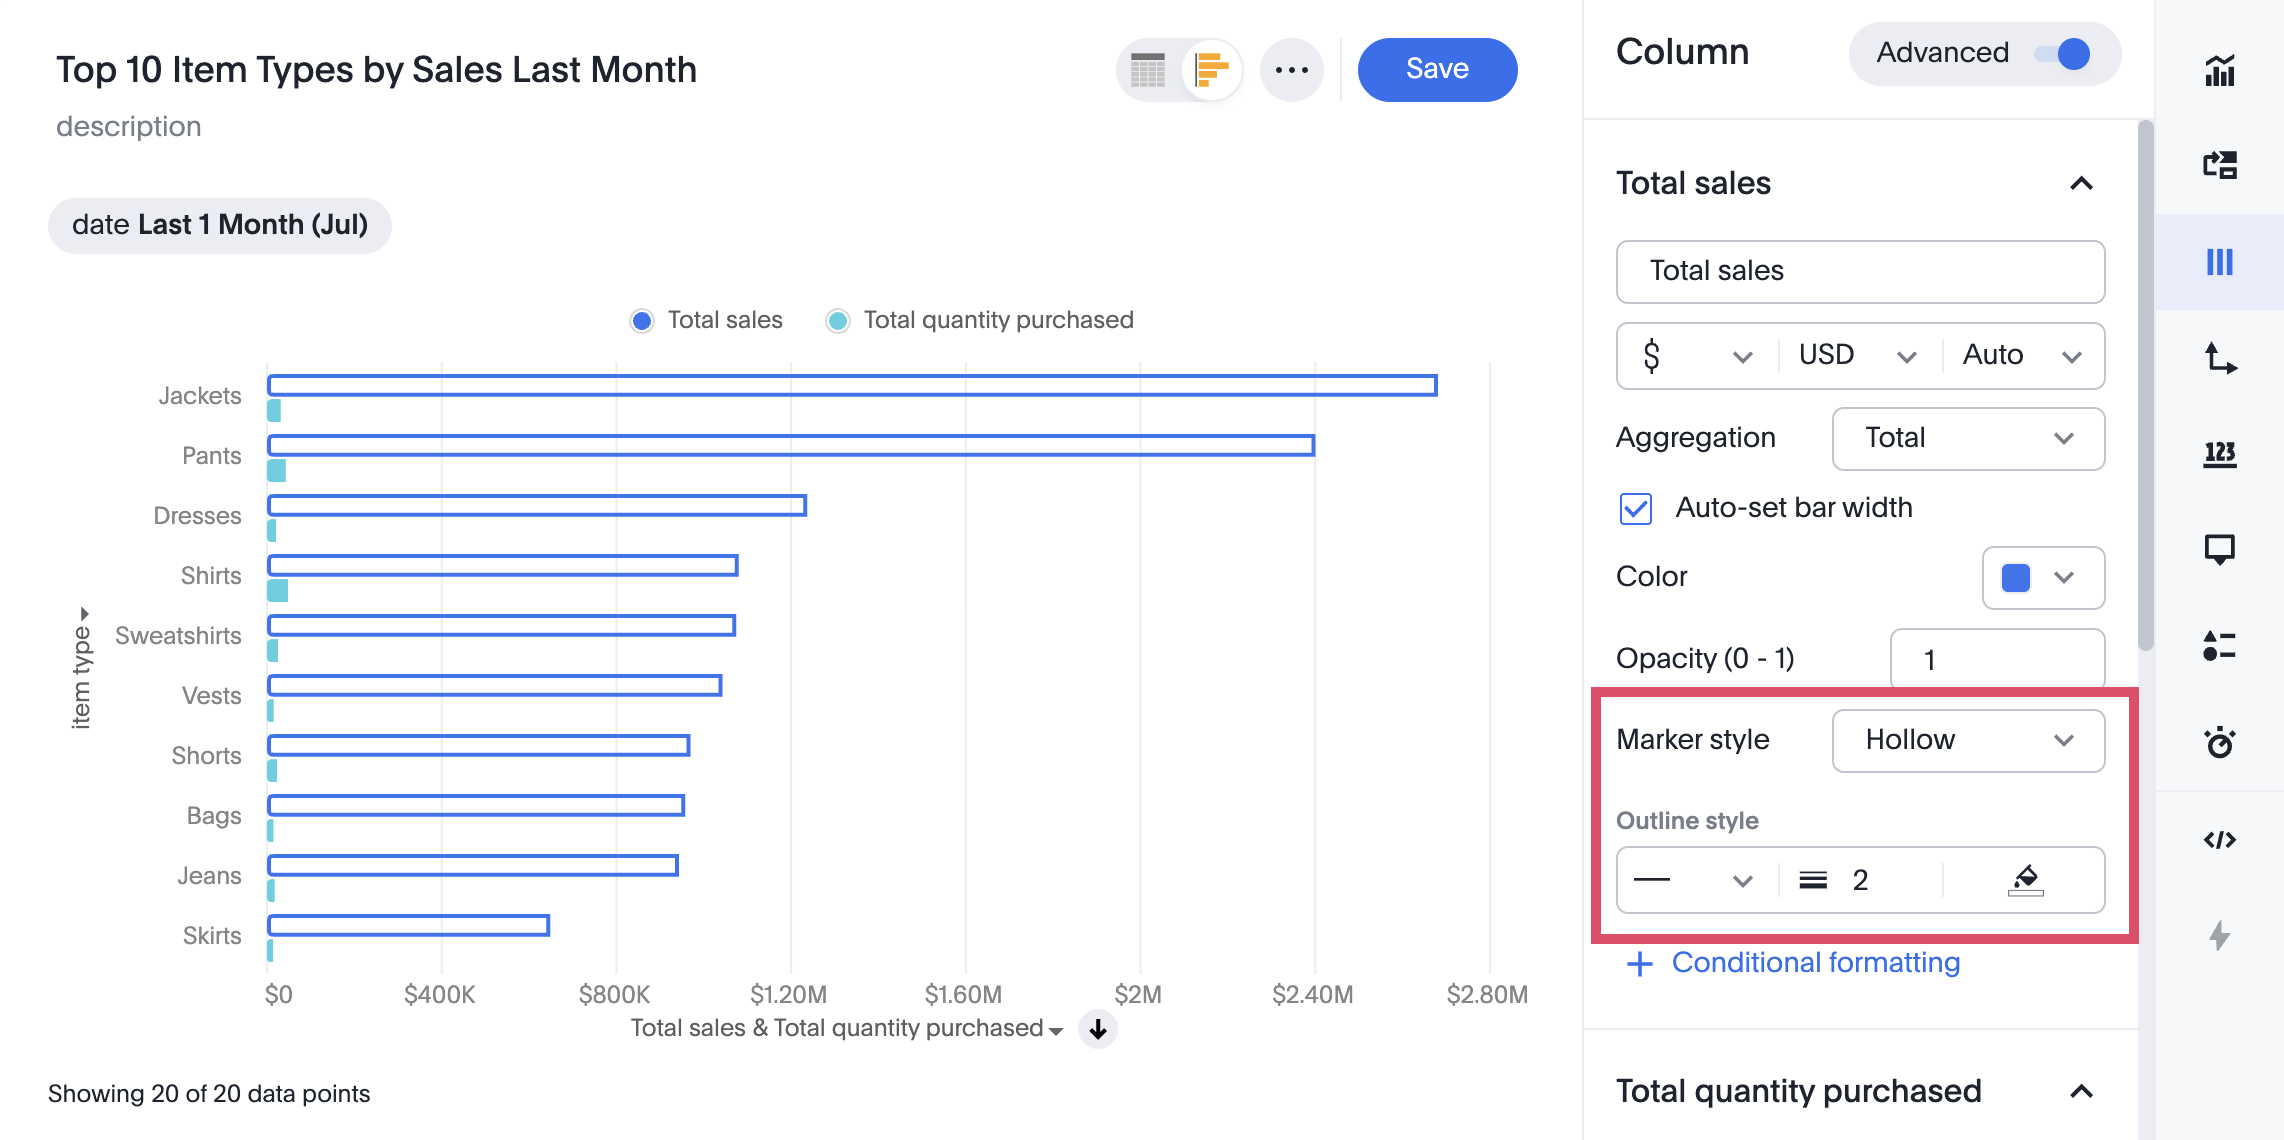
The fill is removed. Only the outline border is rendered, giving marks a ring or hollow appearance. |
Outline |
The fill is rendered, and an outline border is layered on top of the fill. |
Outline style sub-settings
When you select Hollow or Outline, additional sub-settings appear:
| Setting | Description |
|---|---|
Outline width |
Controls the thickness of the outline stroke in pixels. |
Outline color |
Sets the color of the outline. Available when no Slice by Color is applied. When a color encoding is active, the outline automatically inherits the same color as the mark’s fill, darkened for contrast. |
Outline style |
Sets the outline appearance: Solid, Dashed, or Dotted. |
Switching between modes
-
If you switch from Hollow or Outline to Solid, outline sub-settings collapse and are hidden.
-
If you add a Slice by Color while Hollow or Outline is active, the outline color field becomes hidden or disabled, and the outline inherits the color encoding automatically.
-
If you remove a Slice by Color while Hollow or Outline is active, the outline color field becomes editable again, and reverts to the measure color.
Set the mark style for a chart column
Mark style is a per-measure setting. To configure it, follow these steps:
-
Open your chart in ThoughtSpot, then click the Column icon
 on the right side panel to open the Column settings.
 -
Select the measure column you want to style.
-
Under Advanced, expand the Mark Style section.
-
Select the style you want: Solid, Hollow, or Outline.
-
If you selected Hollow or Outline, configure the sub-settings:
-
Set Outline width (in pixels).
-
Set Outline color using the color picker (when no Slice by Color is active).
-
Set Outline style: Solid, Dashed, or Dotted.
-
-
Your changes apply immediately to the chart.