Spreadsheet
Spreadsheet gives you a familiar, grid-based way to work with your data model, table and datasets without leaving the platform.
You open a data model as a spreadsheet, add calculated columns with ThoughtSpot formulas, sort, filter, add conditional formatting and format the grid, then save your work as an Answer.
Because Spreadsheet opens a ThoughtSpot Model, it inherits that Model’s row-level security, column-level security, joins, and formula logic. You get spreadsheet flexibility on live, governed data, with no export step and no loss of security.
This page is a reference for the actions available in Spreadsheet. For step-by-step workflows, see the related how-to pages linked at the end.
Before you begin
-
You need access to at least one Model in ThoughtSpot.
-
Spreadsheet works on aggregated data from the Model. Every action you take runs a live query against the Model.
-
Row-level and column-level security defined on the Model are always enforced. You only see data you are permitted to see.
Entry points
You can open spreadsheets from several places in ThoughtSpot
| Entry point | Where to find it | What happens |
|---|---|---|
Search Data toolbar |
In Search Data, select a Model and click on Spreadsheet mode in the visualization toolbar. |
The current result opens in spreadsheet mode. Columns you selected in Search Data carry over. |
Answers list |
Open a saved Answer tagged Spreadsheet. |
The Answer reopens directly in spreadsheet mode. |
Shared Answers |
Open a shared Answer in a spreadsheet mode. |
The Answer opens in spreadsheet mode for users with access. |
Toolbar reference
The toolbar keeps the most common actions one click away while maximizing grid space. The table below defines each icon, from left to right.

| Control | Description |
|---|---|
Undo / Redo |
Step backward or forward through your recent actions. Click the button multiple times to go back or forward multiple steps. |
Sort |
Open the advanced sort dialog to sort by one or more columns. |
Conditional formatting |
Apply color rules that highlight cells based on their values. |
Text alignment |
Choose whether column contents are left-aligned, center-aligned, or right-aligned. |
Wrap text |
Choose if text in columns should wrap to the next line. |
Format as currency |
Format the numbers as currency. |
Format as percent |
Format the numbers as percentages. |
Decrease decimal places |
Round numbers up to an earlier decimal place. |
Increase decimal places |
Include an additional decimal place. |
More formats |
Choose to format as automatic, number, currency, or percent. |
Style |
Control how the rows appear (alternating colors, choose the colors), row height, and choose to show or hide column gridlines, row gridlines, row numbers, and prefixes. The prefix displays the aggregation type of a numerical column, or the date bucket of a date column, and updates with any change you make. |
Filter |
Filter by a column. |
Formula (fx) |
Add a calculated column using a ThoughtSpot formula. See Formulas. |
Download |
Download the spreadsheet in XLSX or CSV format. |
Full screen |
Expand the grid to fill the screen. Also available with the F key. |
| All tooltips for the toolbar localize to match the system language selected in your user profile. |
- Save Answer
-
Save the current spreadsheet as an Answer. Also available with Cmd/Ctrl + S.
- Formula bar
-
The formula bar shows the address of the selected cell. When you select a cell in a formula column, it shows the formula that produced the column.
TML
Click the More options menu  , next to Save Answer, to access TML options.
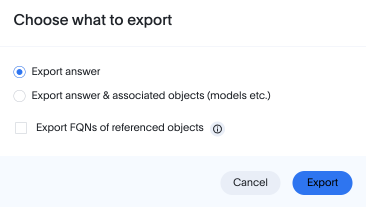
- Export
-
Click Export to export your spreadsheet as TML. You can choose to also export the FQNs of objects referenced in the spreadsheet. Your tml file downloads into your browser. Once downloaded,you can upload the TML file through Utilities to open your spreadsheet answer in another Org.
- Update answer
-
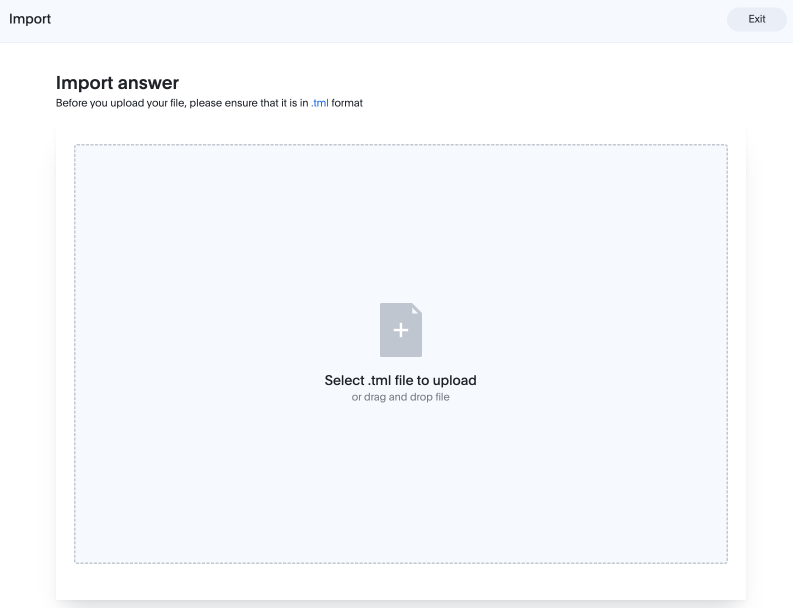
Click Update answer to replace the spreadsheet with an imported TML file.
- Edit
-
Click Edit to edit your spreadsheet in TML format.
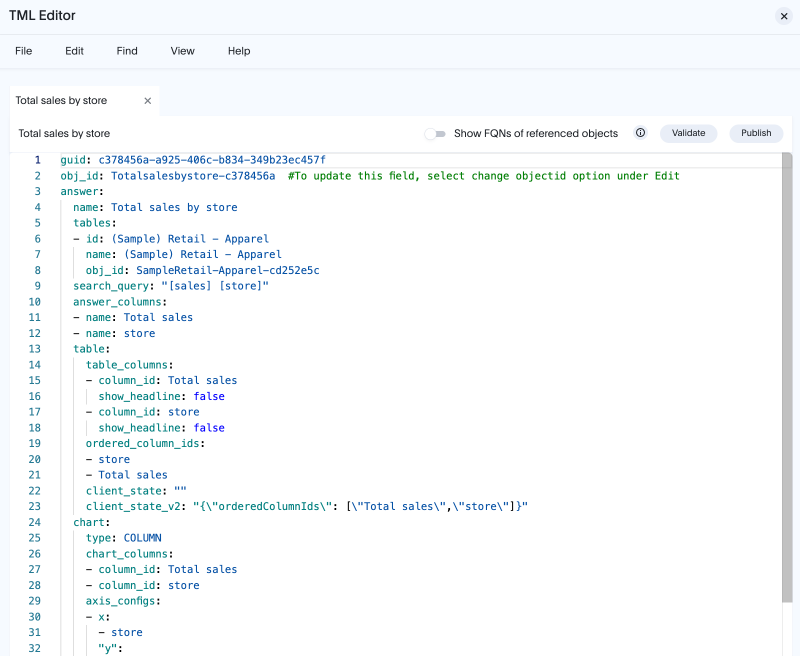
| You can only select Update answer and Edit on a saved spreadsheet. |
Columns
| Action | How to do it | Notes |
|---|---|---|
Add new calculated field |
Click the down arrow in a column header and select New calculated field. Then enter the formula in the formula bar. |
You can rename the column after creating the formula. |
Change time bucket |
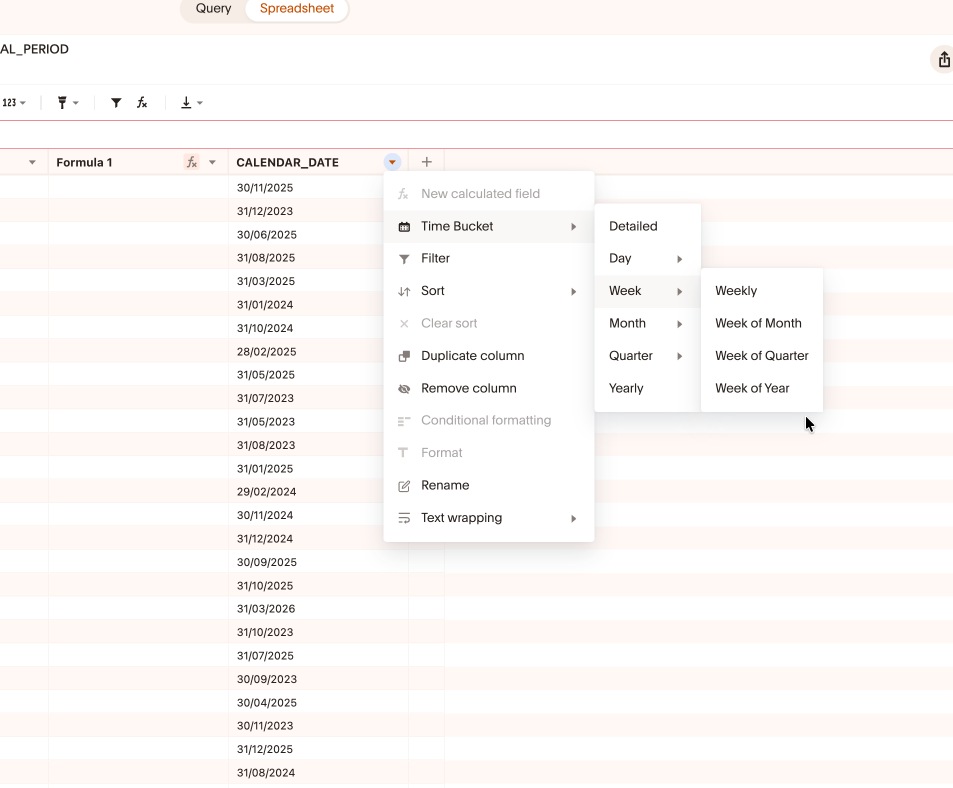
Click the down arrow in a date column header and select Time bucket. |
Select the time bucket for the date column as detailed, day, week, month, quarter, or year. Each period of time can be further selected as, for example, "day of week, day of month, day of quarter, day of year". |
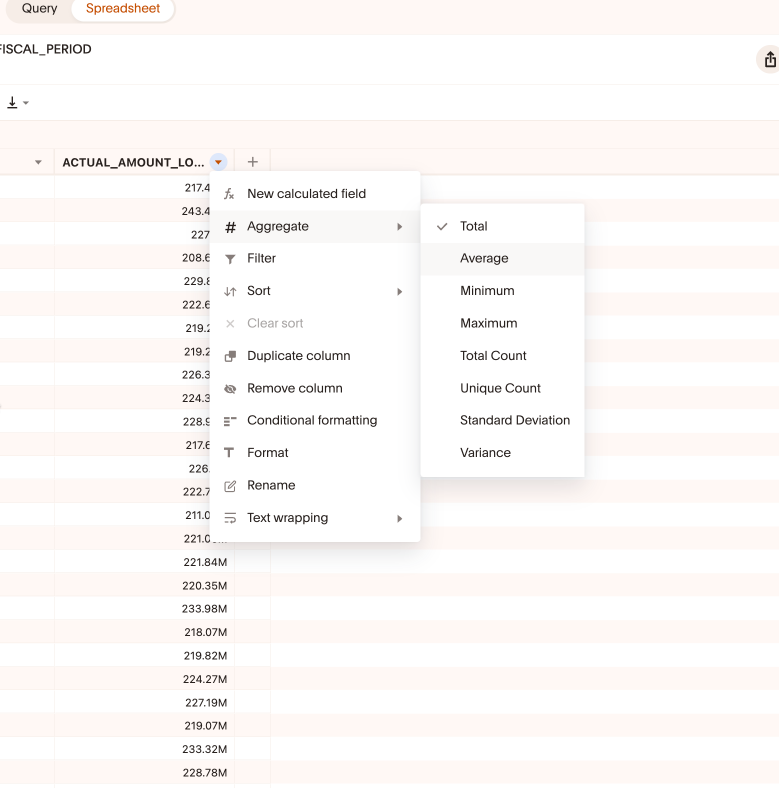
Change column aggregation |
Click the down arrow in a column header and select Aggregate. |
You can choose to aggregate the column as a total, an average, a minimum, a maximum, a total count, a unique count, a standard deviation, or a variance. |
Filter |
Click the down arrow in a column header and select Filter. Then add the filter condition in the pop-up. |
You can create a filter for values that are equal to, not equal to, greater than, greater than or equal to, less than, less than or equal to, or between your selected value(s). |
Sort |
Click the down arrow in a column header and select Sort. |
You can sort ascending or descending. |
Clear sort |
Click the down arrow in a column header and select Clear sort. |
The values in the column return to their previous configuration. |
Duplicate column |
Click the down arrow in a column header and select Duplicate column. |
The duplicate column appears next to the original column. |
Remove column |
Click the down arrow in a column header and select Remove column. |
Removes the column entirely from your spreadsheet. |
Conditional formatting |
Click the down arrow in a column header and select Conditional formatting. |
In the pop-up that appears, choose to add conditional formatting, whether value-based or column-based, and choose its styling. |
Format |
Click the down arrow in a column header and select Format. |
You can only select format for columns with numerical values. You can choose to format as number, currency, or percentage, decide the units (Auto, None, Thousands (K), Million (M), Billion (B), or Trillion (T)), choose how many decimal places, and choose how to format negative numbers. You can also choose whether to display the thousands separator. |
Rename |
Click the down arrow in a column header and select Rename. |
Enter the new name in the columns header. |
Text wrapping |
Click the down arrow in a column header and select Text wrapping. |
You can decide to wrap text, or clip it at the border of the column. |
- Reorder columns
-
Drag a column to a new position. Column order is saved with the Answer.
- Source vs. formula columns
-
Columns that come from the Model are read-only. Formula columns you create are editable and are shown with a distinct visual style so you can tell them apart. Note that you select Remove column to remove a source column from your spreadsheet, and Delete column to delete a column you created on the sheet.
Formulas
Formula columns let you derive new values from existing Model columns. You can compute metrics, apply business rules, transform text, work with dates, and handle missing values, all in ThoughtSpot-native formula syntax.
Add a formula column from the fx button in the toolbar, or from the + icon in the column header row. As you type, autocomplete suggests column names, and a preview shows the result before you commit. If a formula is invalid, an inline error explains the problem in plain language.
Formula syntax is ThoughtSpot-native, not Excel. Functions use lowercase names and reference columns in square brackets, for example sum([Revenue]). Excel-style syntax (such as SUM(A:A)) is not supported in this release.
Referencing columns and values
-
Column references use square brackets:
[Revenue],[Customer Name],[Order Date]. Bracket syntax preserves column names that contain spaces. -
Text literals use single quotes:
'West','Closed Won'. -
Numbers and operators are written directly:
[Revenue] - [Supply Cost],[Price] * [Quantity].
Operators
| Type | Operators | Example |
|---|---|---|
Arithmetic |
|
|
Comparison |
|
|
Logical |
|
|
Conditional logic
Use if … then … else to encode decision rules. You can nest conditions for banding.
if ([Revenue] > 1000) then 'High' else 'Low'

if ([Discount] >= 7) then 'High'
else if ([Discount] >= 3) then 'Mid'
else 'Low'
Aggregation functions
| Function | Description | Example |
|---|---|---|
|
Sum of a measure |
|
|
Average of a measure |
|
|
Count of non-null values |
|
|
Count of distinct values |
|
|
Largest value |
|
|
Smallest value |
|
|
Standard deviation |
|
|
Conditional sum |
|
|
Conditional count |
|
|
Conditional average |
|
|
Sum at a specified grouping level |
|
|
Running sum over an ordered attribute |
|
Window functions
| Function | Description | Example |
|---|---|---|
|
Moving average over a window |
|
|
Moving sum over a window |
|
Math functions
| Function | Description | Example |
|---|---|---|
|
Absolute value |
|
|
Round to a number of decimals |
|
|
Round up |
|
|
Round down |
|
|
Remainder |
|
|
Raise to a power |
|
|
Square root |
|
|
Divide, returning 0 instead of an error when the denominator is 0 |
|
Conditional and null-handling functions
| Function | Description | Example |
|---|---|---|
|
Tests whether a value is null |
|
|
Returns a replacement when a value is null |
|
String functions
| Function | Description | Example |
|---|---|---|
|
Join strings |
|
|
Tests whether a string contains a substring |
|
|
Extract part of a string (position is 0-based) |
|
|
Leftmost characters |
|
|
Rightmost characters |
|
|
Convert to uppercase |
|
|
Convert to lowercase |
|
|
Remove leading/trailing whitespace |
|
|
Length of a string |
|
|
Replace a substring |
|
Date functions
| Function | Description | Example |
|---|---|---|
today |
Current date |
today() |
now |
Current timestamp |
now() |
year |
Year from a date |
year([Order Date]) |
month_number |
Month number (1–12) from a date |
month_number([Order Date]) |
day_of_week |
Day of week from a date |
day_of_week([Order Date]) |
quarter_number |
Quarter number from a date |
quarter_number([Close Date]) |
add_days |
Add days to a date |
add_days([Order Date], 30) |
diff_days |
Days between two dates |
diff_days([Order Date], today()) |
start_of_month |
First day of the month for a date |
start_of_month([Order Date]) |
to_date |
Convert a string to a date using a format mask |
to_date(Date String, [yyyy-MM-dd]) |
- Lookups
-
There is no lookup function. To bring in values from another table, add that table as a joined dimension in the data model. The join is then available to every spreadsheet built on the Model.
| This release inherits the ThoughtSpot formula engine (approximately 70+ functions). The tables above list the most common functions for spreadsheet work; for the complete function list and exact signatures, see the ThoughtSpot formula reference. |
Sorting
Sort applies to the full result set, not just the visible page.
| Action | How to do it |
|---|---|
Sort a single column |
Open the column header dropdown and select ascending or descending. |
Sort by multiple columns |
Select Sort in the toolbar to open the advanced sort dialog and add levels (for example, Region ascending, then Revenue descending). |
Sort by a formula column |
Sort formula columns the same way as source columns. |
Sort is session-only. Sorting is not saved with the Answer. When you save, the save dialog notes that sort order will not be retained.
Filtering
Filters narrow the rows shown in the grid and run against the full result set. You can apply filters to more than one column at a time.
| Action | How to do it |
|---|---|
Filter a column |
Open the column header dropdown and set filter conditions, or select Filter in the toolbar. |
Remove a filter |
Select the X on the filter chip in the filter bar. |
Filter options adapt to the column’s data type:
-
Numeric columns: range conditions (between, greater than, less than).
-
Text columns: multi-select of specific values, with search to find values quickly.
-
Date columns: date-range selection.
Filters are now saved with the Answer, and appear when you reopen it.
Conditional formatting
Conditional formatting highlights cells based on their values, so you can spot outliers and priorities without reading every row. Apply it from the toolbar. You can add more than one rule to the same column, and clear all rules to remove the formatting.
| Rule type | Description |
|---|---|
Threshold |
Fill or highlight cells that meet a condition (for example, red if value is below 1,000,000). |
Color scale |
Apply a gradient across a column’s range (for example, green-yellow-red). |
Conditional formatting is applied in your browser only; it does not change the underlying data.
Conditional formatting is session-only. It is not saved with the Answer. The save dialog notes that formatting rules will not be retained.
Saving and what persists
Select Save as Answer in the toolbar (or press Cmd/Ctrl + S) to save your work. Saving creates a self-contained Answer tagged spreadsheet. It does not modify the underlying data model.
Some of your work is saved with the Answer, and some applies only to your current session. The save dialog lists the formula columns being saved and reminds you that sort, filter, and conditional formatting are session-only.
| Item | Saved with the Answer? |
|---|---|
Formula columns |
Yes |
Column order |
Yes |
Column visibility (hidden/shown) |
Yes |
Sort order |
No — session only |
Filters |
Yes |
Conditional formatting |
No — session only |
A saved spreadsheet Answer always reopens in spreadsheet mode. Its formula columns are also visible when the Answer is viewed as a standard table.
Governance and security
-
Row-level security (RLS) and column-level security (CLS) from the Model are enforced in Spreadsheet. You see only the rows and columns you are permitted to see.
-
Formula columns are stored in the Answer, not in the Model. They do not change the shared Model and are not visible to other users unless you share the Answer with them.
-
CSV download respects the active row-level security and filters.