This draft documentation may be incomplete or inaccurate, and is subject to change until this release is generally available (GA).

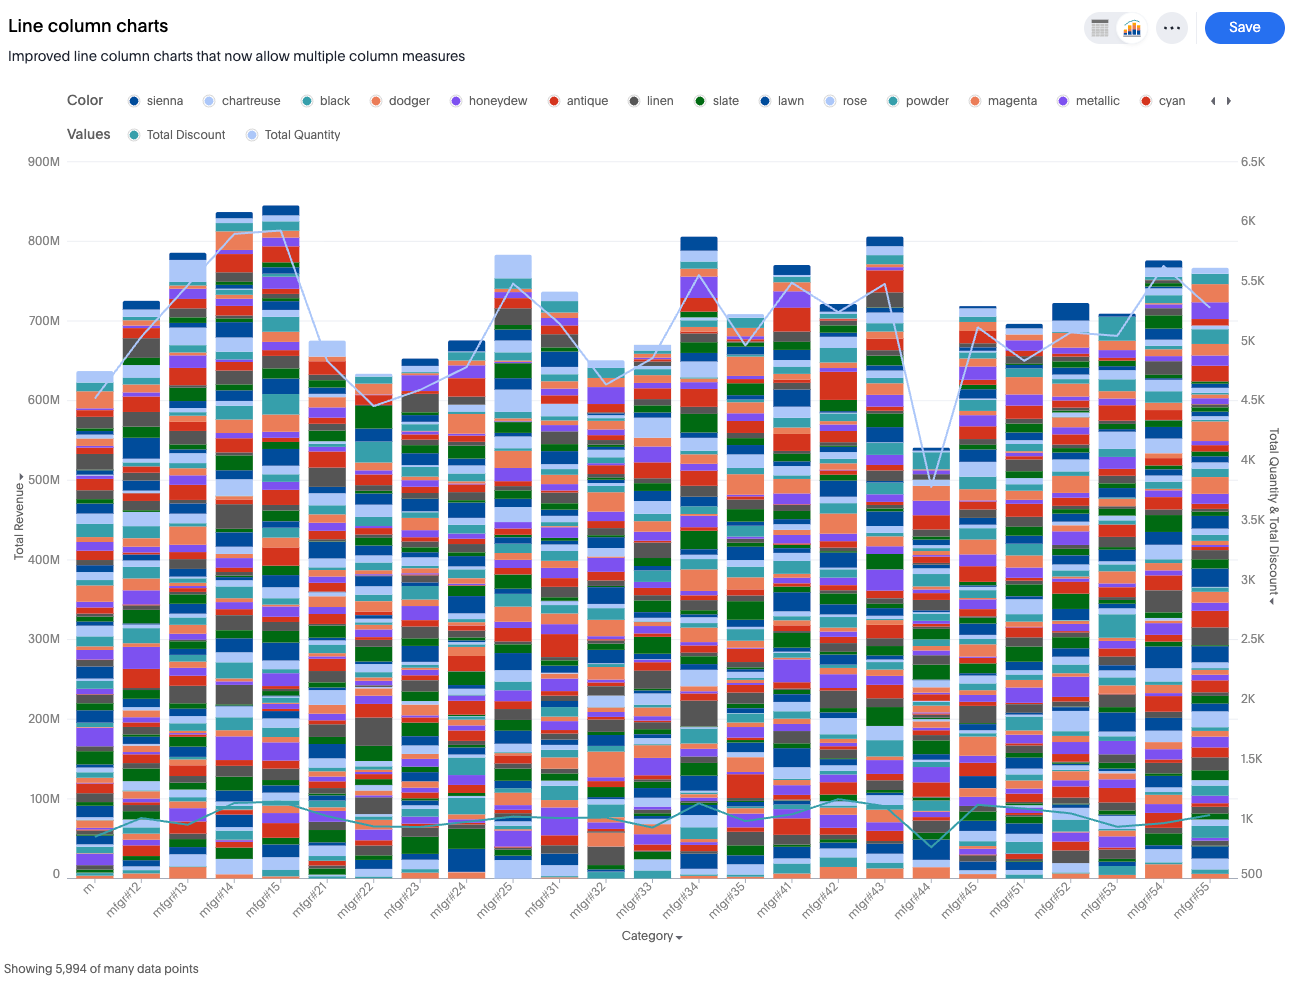
New line stacked column charts

Last updated: Jan 22, 2026

The new line stacked column chart is similar to the line column chart, except that it divides its columns with an attribute in the legend. The line stacked column chart combines new stacked column and new line charts. There are two y-axes, one for each measure.

Stacked line column chart example

New line stacked column chart features

  • Drop measures into the designated bar or line buckets to instantly configure the chart.

Supported configuration

  • A line-column chart supporting 'n' measures for the line axis and one measure for the column axis.

Automatic transformations

  • A dual-axis setup is created.

  • Line measures share one axis, represented by an "MV" construct with an identity transform.

  • The column measure occupies the second, single-measure axis.

Default chart recommendations

  • For two or more measures and one attribute, make the measure a bar, and make the others lines.

  • For two or more measures and two or more attributes, use a multivariate stacked chart.

Limitations

  • Dual-axis or multivariate axis transitions are not allowed

  • At most one measure can be visualized as a bar.

  • No more than one measure can be added to the column axis.

  • A third axis entity is not allowed.

  • Neither axis entities can be removed nor emptied.

  • Internal dual-axis configuration is not supported for the line axis.


Was this page helpful?