Creating charts with Muze Studio
Muze Studio is a code execution sandbox built into ThoughtSpot. It lets you create fully custom charts directly inside an Answer — going beyond ThoughtSpot’s native chart types — without leaving the ThoughtSpot interface.
Muze Studio can execute and render three types of chart code:
-
Muze syntax — Use ThoughtSpot’s in-house charting library, Muze, to build composable, layered charts using the code written in Muze syntax. For an introduction to the Muze library, see Introduction to Muze.
-
Custom JavaScript, CSS, and HTML — Write standard web code to render any visualization without relying on a specific charting library.
-
Third-party charting libraries — Import and use browser-compatible libraries such as Chart.js or D3.js to render any chart type your use case requires.
You can also browse and use any of the available charts in the Muze chart gallery. For more information, see Muze chart gallery.
| Charts created in Muze Studio are associated with an individual Answer. Other users can copy the Answer and modify it to reuse the same chart. |
The code editor
The Muze Studio code editor has four components:
-
JavaScript editor — Render charts using the Muze API, custom JavaScript, or a third-party library.
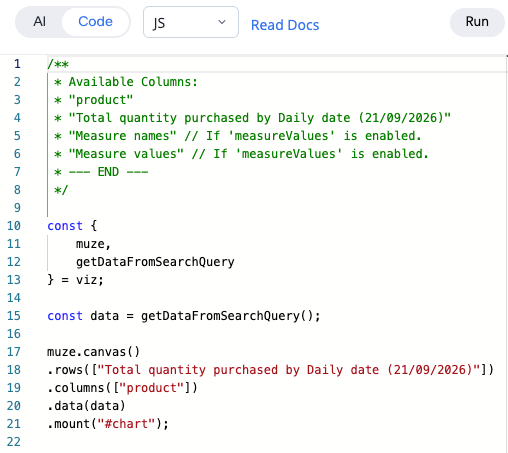
The following APIs and data are available:
+ Muze library: The full Muze API for composing chart layers, cross-canvas interaction, and more. Data and DataModel: Data from your ThoughtSpot search query is available directly. Use Muze’s in-memory DataModel component to apply filters, group-by operations, and selections before rendering. * *Color palettes: Use the color API to match the color styles used across ThoughtSpot. By default, your chart inherits the instance-wide color palette.
+ For more information, see Muze API reference.
-
CSS editor — Style your chart using CSS classes.
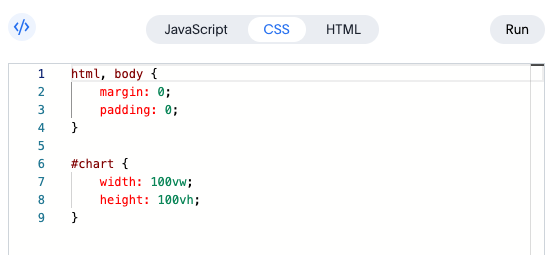
For details, see Styling your charts.
-
HTML editor — Define the chart container, structure the layout, and add elements such as annotations. The
<div>tags you add here define where the visualization renders.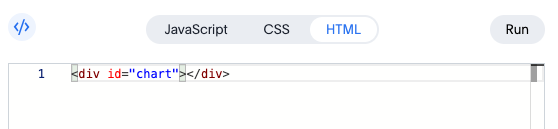
-
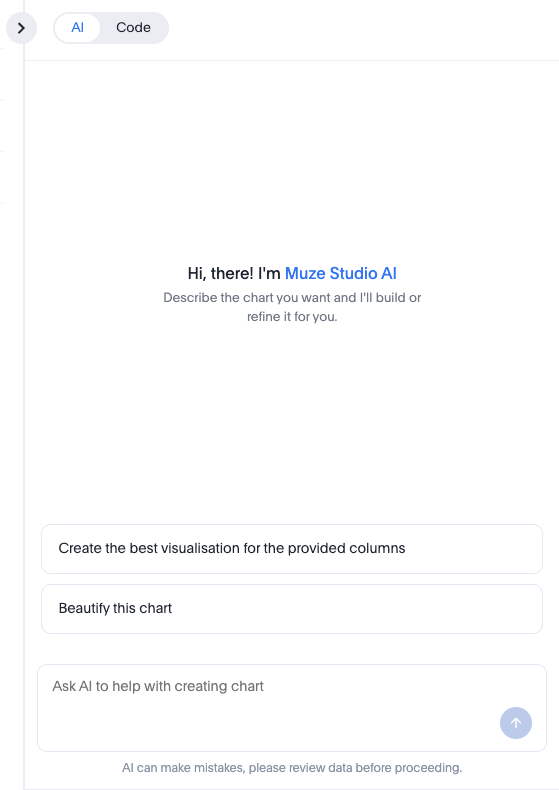
AI chat Beta — Describe your chart requirements in natural language and let ThoughtSpot generate the code for you. The AI analyzes your request, recommends a chart type, and generates the JavaScript, CSS, and HTML code. You can refine the chart through follow-up prompts or switch to the code editors for manual adjustments.
AI chat is a Beta feature, available starting with ThoughtSpot 26.10.0.cl. Your ThoughtSpot administrator must enable Muze Studio AI by contacting ThoughtSpot Support.
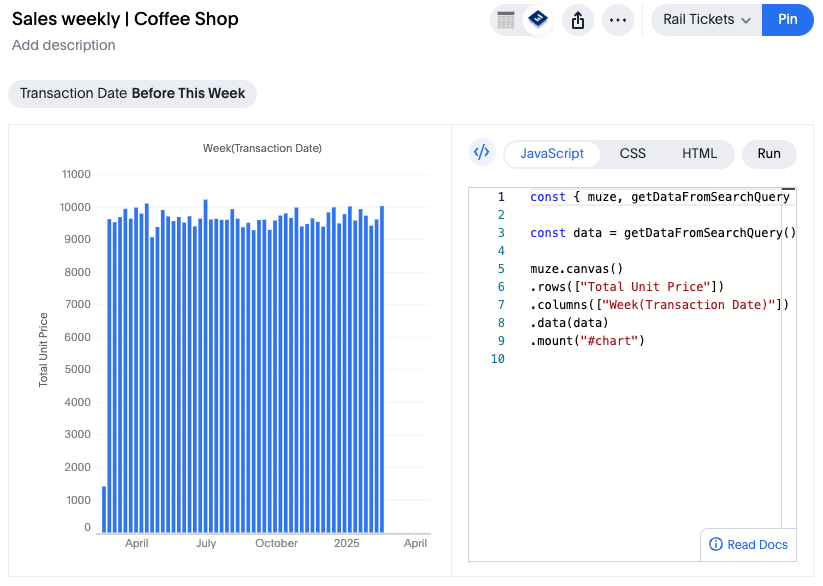
Click Run at any time to preview your changes in the chart preview pane.
Getting started
To create a chart using Muze Studio:
-
Navigate to an Answer in ThoughtSpot.
-
Click the chart type selector.
-
Select Muze Studio from the list of chart types.
-
Once the code editor panel opens, choose your authoring method:
-
Write code manually — Use the JavaScript, CSS, and HTML editors to write chart code directly using Muze syntax, custom JavaScript, or a third-party library.
-
Use AI chat Beta — Select the AI tab, then describe the chart you want in natural language. The AI generates the chart code for you. You can continue to refine the chart through follow-up prompts.
For example, try: "Create a bar chart with a reference line for the average"
If the AI tab is not visible, contact your ThoughtSpot administrator to enable it by contacting ThoughtSpot Support.
-
-
Click Run to preview your changes.
-
To save, click the More menu
 and select Save.
If your Answer is pinned to a Liveboard, click Pin to publish your changes.
Use AI chat to create and refine charts Beta
AI chat is a conversational interface inside Muze Studio that generates chart code from natural-language descriptions. It uses a multi-step AI workflow to analyze your intent, recommend a chart type, and produce formatted code in the JavaScript, CSS, and HTML editors. To enable this feature, your ThoughtSpot administrator must contact ThoughtSpot Support.
Prerequisites
-
Your ThoughtSpot administrator has enabled Muze Studio AI.
-
The Muze Studio chart type is enabled.
Create a chart with AI
-
In an Answer, select Muze Studio as your chart type.
-
Select Editor to open the editor panel.
-
Select the AI tab, if not already selected.
-
Type a description of the chart you want in the prompt field.
Example prompts
-
"Create a bar chart showing revenue by region"
-
"Show a line chart with a trend line"
-
"Make a pie chart of sales by category with data labels"
-
"Create a stacked area chart with a legend at the top"
-
-
Press Enter or select the send button.
-
The AI processes your request and returns:
-
A text explanation of the chart it created
-
The generated code, which populates the JavaScript, CSS, and HTML editors
-
A live preview of the chart
-
Refine the chart
After the AI generates an initial chart, you can:
-
Send follow-up prompts to adjust the chart type, colors, labels, axes, or formatting. For example: "Change the colors to blue" or "Add data labels to each bar".
-
Switch to the Code tab to make manual edits to the generated JavaScript, CSS, or HTML.
-
Select Run to apply your changes and refresh the preview.
The AI maintains your conversation history within the session, so each follow-up prompt builds on the previous context.
AI-managed and manually edited charts
| State | Description |
|---|---|
AI-managed |
The chart was created or last updated through the AI. You can continue refining it with follow-up prompts. |
Manually edited |
You edited the code directly in the Code tab. A notification appears indicating that the chart has been manually modified. Further AI prompts generate new code rather than incrementally refining the manually edited version. |
AI chat limitations
-
Latency: Initial chart generation may take several seconds while the AI processes your request.
-
Chart complexity: The AI works best with standard chart types and common formatting requests. Highly specialized visualizations may require manual code editing.
-
Session persistence: Chat history is maintained during your active session. If you navigate away and return, the session transcript is restored automatically.
-
The AI agent only writes code in the Muze library syntax because it specifically designed for that.
-
The AI agent should not be used on an existing chart because it does not understand existing charts.
Migrating from Muze Studio (version 10.14.0.cl and earlier)
If you created charts using Muze Studio in version 10.14.0.cl or earlier, ThoughtSpot recommends migrating to native Muze charts to resolve known limitations with exports, scheduled reports, version control, and formatting.
Native Muze charts are available by default in the chart type selector from version 26.2.0.cl onwards.
To migrate a chart:
-
Open the Answer containing the chart.
-
Click the chart type selector.
-
Select a chart type from the New section.
ThoughtSpot automatically transfers the chart code to the native Muze chart type. Note that some configurations may not carry over during the migration.
-
Click Save.
|
If your Muze Studio chart uses custom JavaScript or imports a third-party library via an HTML This line is required when using custom JavaScript or third-party libraries. It signals to ThoughtSpot that chart rendering is complete, which is necessary for exports, scheduled reports, and other services to work correctly. For more information, see Charts built with third-party libraries. |
Limitations
| Limitation | Details |
|---|---|
Row limit |
Default maximum of 40,000 rows. |
Browser |
Muze Studio is not supported in the Apple Safari web browser. |
Related information
Agentic charts — Learn how Spotter automatically generates charts for non-token answers