New funnel charts
Funnel charts represent data across multiple stages, showing how values decrease as data progresses through a process. They are useful for visualizing sales pipelines, conversion funnels, recruitment stages, and any multi-step process where you need to understand drop-off rates between stages.
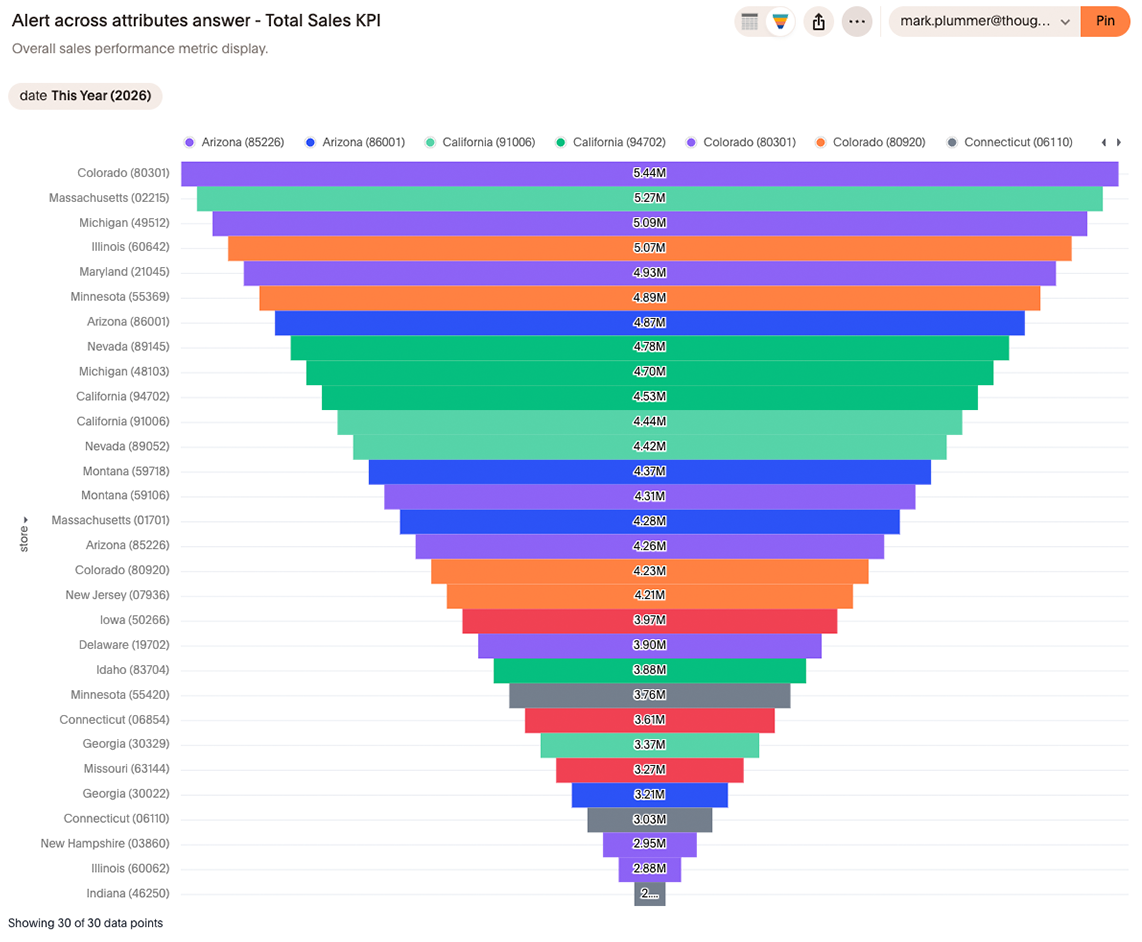
|
Funnel charts are available as part of the new charts library Early Access rollout. Contact ThoughtSpot Support to enable this chart type on your instance. |
Data requirements
To create a Funnel chart, you need:
-
At least one measure
-
At least one attribute representing the funnel stages
New capabilities
The new charts library funnel chart introduces the following capabilities not available in the classic version:
-
Faceting and Trellis chart modes — Partition Funnel charts into faceted grids or trellis small multiples for multidimensional analysis.
-
Improved percentage calculations — Enhanced calculation options for percentages, including:
-
Change from previous step
-
Change from first step
-
Percentage of total
-
-
New funnel configurations — Support for additional funnel layouts:
-
Funnel with multiple measures and no attributes
-
Funnel with multiple measures and one attribute
-
Behavior changes
When migrating from the classic Funnel chart to the new charts library version, note the following changes:
-
Visual appearance — The new Funnel chart uses ranged bars instead of polygons, giving it a different aesthetic appearance.
-
Multiple attributes with one measure — Multiple attributes with one measure will not create concatenated funnel slices. Instead, faceting is applied.
-
Sorting behavior — Sorting by attribute or value changes the actual bar order in the new renderer.
-
Custom font support — Custom font settings apply differently compared to classic charts.
-
Null and empty handling — Null and empty values are handled differently in the new renderer.
-
Non-visualized fields in tooltip — Adding non-visualized fields to tooltips is not supported in the new Funnel chart.
Limitations
The following features are not supported in the new Funnel chart:
-
Data label styling and text backgrounds, borders, and alignment
Configure a Funnel chart
To create a Funnel chart:
-
Start a new search or open an existing Answer.
-
In the chart selector panel, select Funnel.
-
Add at least one measure and one attribute representing your funnel stages.
-
Use the chart settings panel to select your preferred percentage calculation method.
-
Configure faceting or trellis options for multi-dimensional analysis.