New waterfall charts
Waterfall charts show how an initial value increases or decreases through a series of intermediate positive and negative values, leading to a final total. They are commonly used for financial analysis, such as visualizing profit and loss statements, revenue breakdowns, and cash flow analysis.
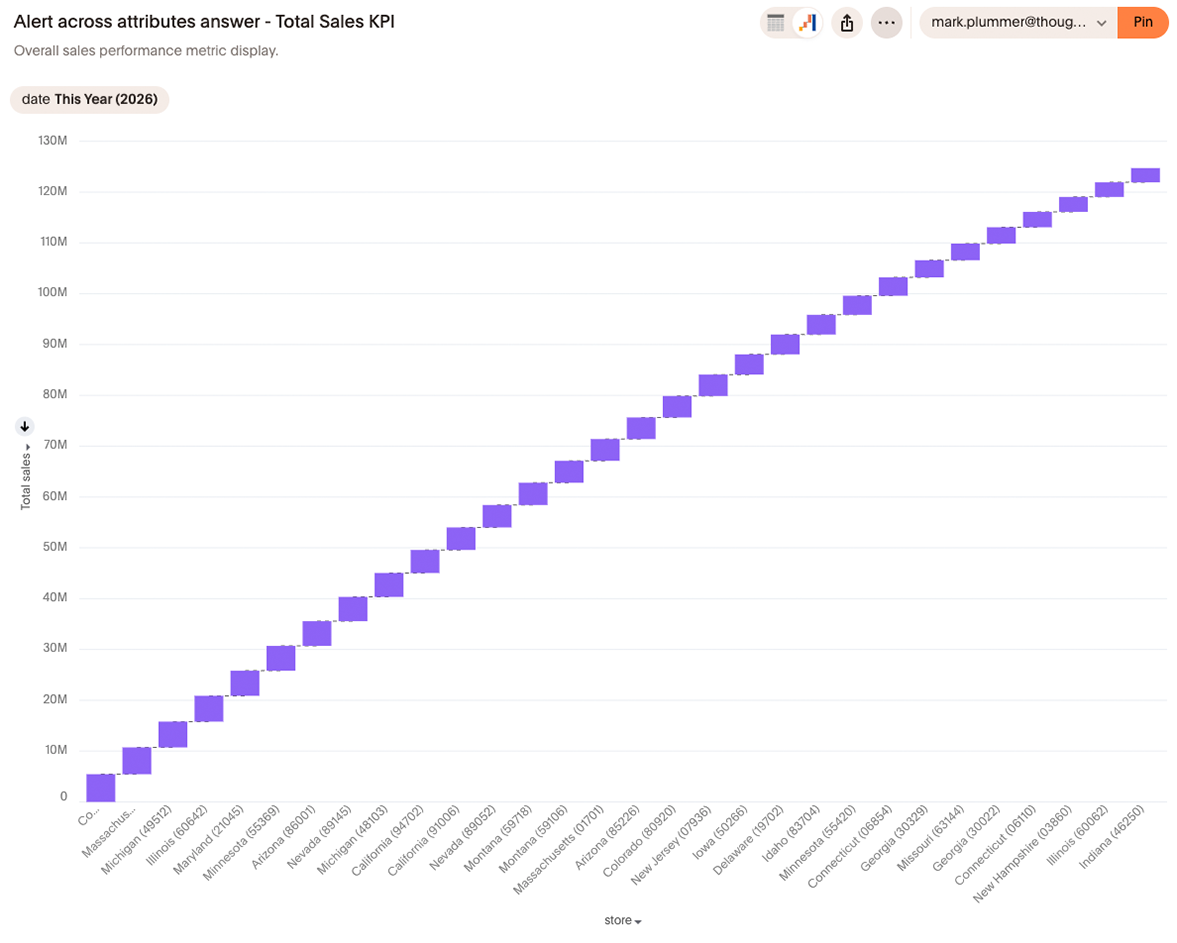
|
Waterfall charts are available as part of the New charts library Early Access rollout. Contact ThoughtSpot Support to enable this chart type on your instance. |
Data requirements
To create a Waterfall chart, you need:
-
At least one measure
-
At least one attribute
New capabilities
The new charts library version of the Waterfall chart introduces the following capabilities not available in the classic version:
-
New color configuration logic for increments and decrements — Configure distinct colors for positive (increment) and negative (decrement) bars to improve visual clarity.
-
New axis configuration logic for multivariates and grouped axis — Build complex multivariate Waterfall charts with improved axis handling.
-
Faceting and Trellis chart modes — Partition Waterfall charts into faceted grids or trellis small multiples for multidimensional analysis.
-
Configurable total and ending bars — Designate specific bars as total or ending values, which are rendered differently from intermediate increment and decrement bars.
Behavior changes
When migrating from the classic Waterfall chart to the new charts library version, note the following changes:
-
Classic Bar width settings unavailable — Group padding and bar padding settings are not available in the new Waterfall chart. This is consistent with other new charts library charts.
-
Connector lines — Connector lines between bars behave differently in the new renderer.
-
Custom font support — Custom font settings apply differently compared to classic charts.
-
Null and empty handling — Null and empty values are handled differently in the new renderer.
-
Non-visualized fields in tooltip — Adding non-visualized fields to tooltips is not supported in the new Waterfall chart.
Limitations
The following features are not supported in the new Waterfall chart:
-
Data label styling and text backgrounds, borders, and alignment
-
N-axis and multi-axis configurations
Configure a Waterfall chart
To create a Waterfall chart:
-
Start a new search or open an existing Answer.
-
In the chart selector panel, select Waterfall.
-
Add at least one measure and one attribute to your query.
-
To configure total bars, open the chart settings and specify which values should render as totals.
-
Customize colors for increments and decrements in the chart settings panel.